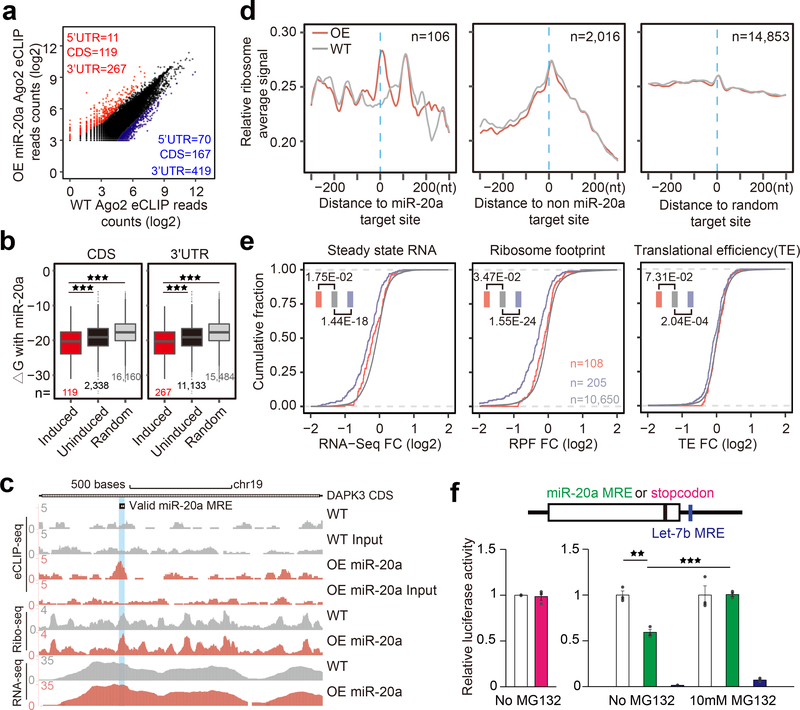
Fig. 6. Impact of CDS-targeted miRNAs on ribosome binding.
a, Scatter plot of combined Ago2 eCLIP data before and after miR-20a overexpression. Red and blue: Induced and decreased Ago2 peaks, separately counted in 5’UTR, CDS, and 3’UTR. b, Boxplots of base-pairing potential (based on ΔG) between miR-20a and sequences underlying miR-20a overexpression-induced Ago2 peaks in CDS (left) or 3’UTR (right) relative to uninduced Ago2 peaks or random sites. The median value for each group is shown with a horizontal gray line. Filled boxes extend from the first to the third quartile. The upper/lower whisker extends from the hinge to the highest/lowest value that is within 1.5 * IQR of the hinge, where IQR is the inter-quartile range. Data beyond the end of the whiskers are outliers and plotted as points. *p<0.05; **p<0.01; ***p<0.001 (Student’s t-test). c, UCSC genome browser view of Ago2 eCLIP-seq, Ribo-seq, and RNA-seq tracks on the DAPK3 transcript before and after miR-20a overexpression, all based on combined reads from independent replicates of each experiment. d, Meta-gene analysis of RFPs on miR-20a overexpression-induced Ago2 peaks (left), all other Ago2 peaks (middle) or on random sites (right). Gray and red tracks: RPFs before and after miR-20a overexpression, respectively. e, Accumulative distribution of RNA-seq, Ribo-seq, and translation efficiency fold-change (FC) in response to miR-20a overexpression. Red and blue: Transcripts containing miR-20a induced Ago2 peaks in CDS or 3’UTR (note that transcripts containing Ago2 in both CDS and 3’UTR were not included in the analysis); Gray: Transcripts without significant Ago2 binding peak. See Supplementary Fig.5 for additional Ago2 eCLIP and ribosome profiling related data. f, Evidence for CDS-targeted miRNA-induced degradation of nascent polypeptide. Left, luciferase assay of the reporters containing a normal stop codon or the stop codon moved to 6nt upstream. Right, luciferase assay of the reporters carrying the miR-20a target site in the CDS region near the 3’end with or without MG132 treatment. Quantitative results were based on 3 independent experiments and expressed as mean+/−SEM. **p<0.01; ***p<0.001 (Student’s t-test).

