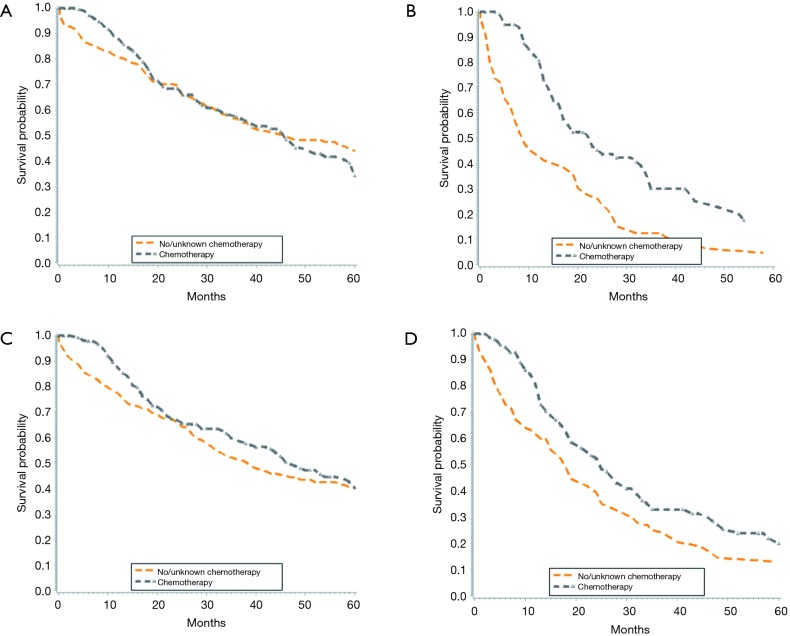
Figure 3.
Kaplan-Meyer survival curves for patients with intrahepatic cholangiocarcinoma. (A) Lymph node-negative patients with and without chemotherapy; (B) lymph node-positive patients with and without chemotherapy; (C) patients with T1/T2 tumors with and without chemotherapy; (D) patients with T3/T4 tumors with and without chemotherapy.

