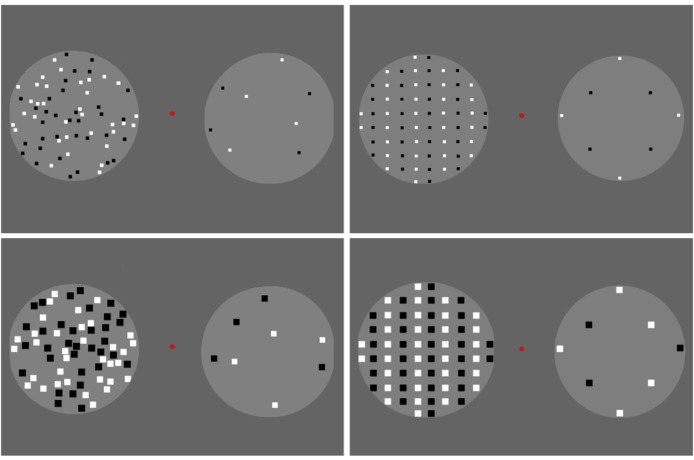
FIGURE 1.
Adaptors used in Experiment 1. The randomly distributed adaptors are shown on the left-hand side, and the regularly distributed (vertical queues) adaptors are shown on the right-hand side. The small adaptors are shown in the upper row, and the large adaptors are shown in the lower row. Dots were generated within two-fixed circles. A total of 68 dots were displayed in one circle, and eight dots were arranged in the other.

