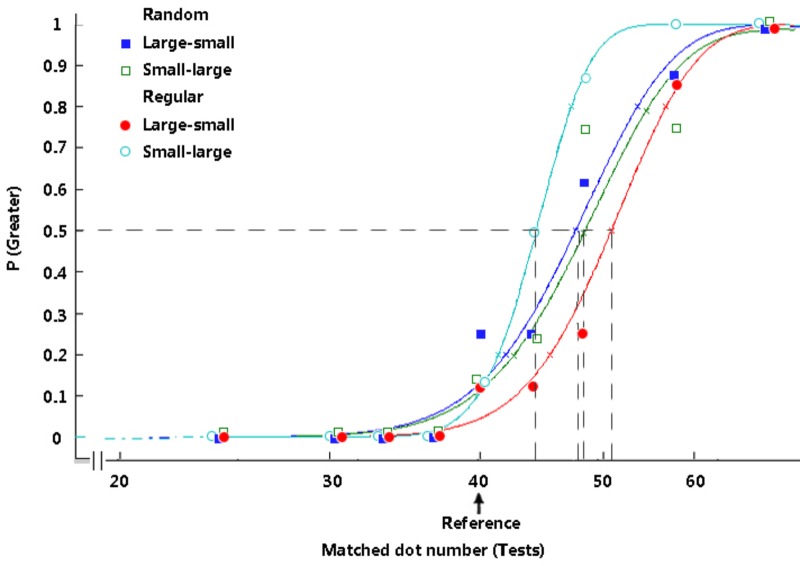
FIGURE 3.
Typical psychometric functions under distinct conditions in Experiment 1. The proportion of trials in which the test stimuli appeared to be more numerous is plotted as a function of the number of test dots, and the vertical dashed lines reveal the PSEs. The arrow indicates the reference number. The participants’ typical responding curves are displayed to indicate the average PSE results. In the random group, filled rectangles, dark-blue curve = large adaptors and small tests; open rectangles, green curve = small adaptors and large tests. In the regular group, filled circles, red curve = large adaptors and small tests; open circles, light-blue curve = small adaptors and large tests.

