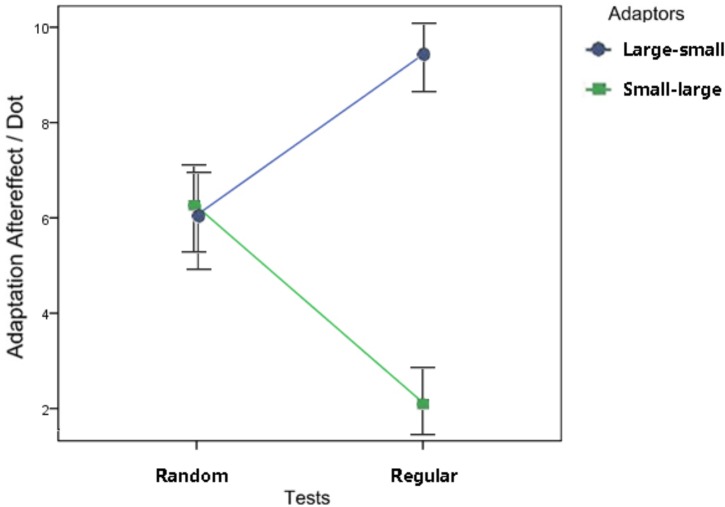
FIGURE 4.
Results of the ANOVA in Experiment 1. A significant interaction was found between the dot distribution (the two shapes on the left of Figure 4 = random adaptors, references, and tests; the other two shapes on the right = regular adaptors, references, and tests) and the size relationship (circles = adapting to large dots and tested by small dots; rectangles = adapting to small dots, and tested by large dots). In the regular groups, a greater adaptation effect was revealed in the large-small condition than in the small-large condition. In the random groups, however, the difference between conditions with those two size relationships was not significant. Error bars represent 1 standard error of the mean.

