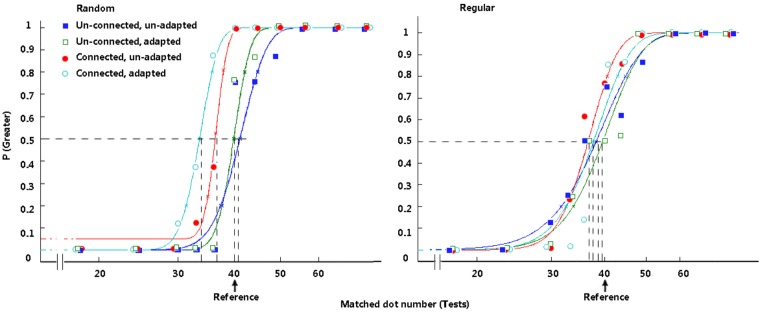
FIGURE 7.
Typical psychometric functions in Experiment 2. The functions in the random group are presented on the left. The functions in the regular group are presented on the right. In each group, filled rectangles, dark-blue curve = treatments with an unconnected reference and without an adaptor; open rectangles, green curve = treatments with an unconnected reference and with an adaptor; filled circles, red curve = treatments with a connected reference and without an adaptor; open circles, light-blue curve = treatments with a connected reference and with an adaptor.

