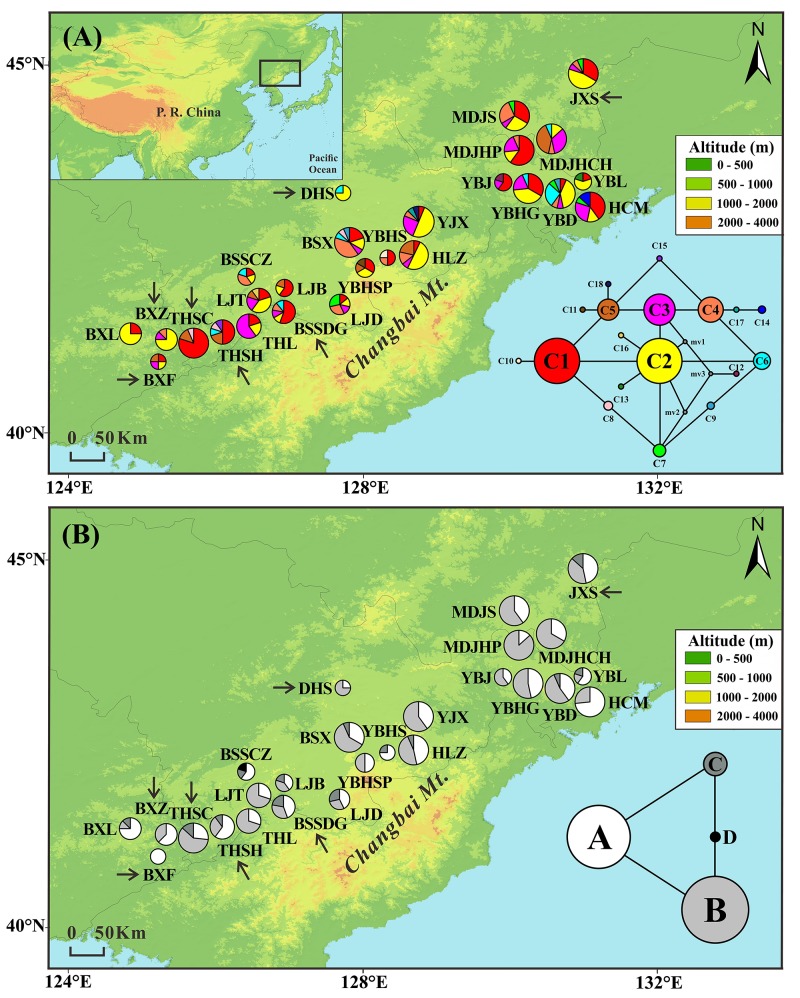
FIGURE 1.
Frequencies of 18 chloroplast DNA haplotypes (A) and four mitochondrial DNA haplotypes (B) of T. cuspidata in each population. The circle size is proportional to the sample size. Insets in the bottom right-hand corner display the two haplotype networks with circle size proportional to the haplotype frequency over all populations. Arrows indicate transplanted populations.

