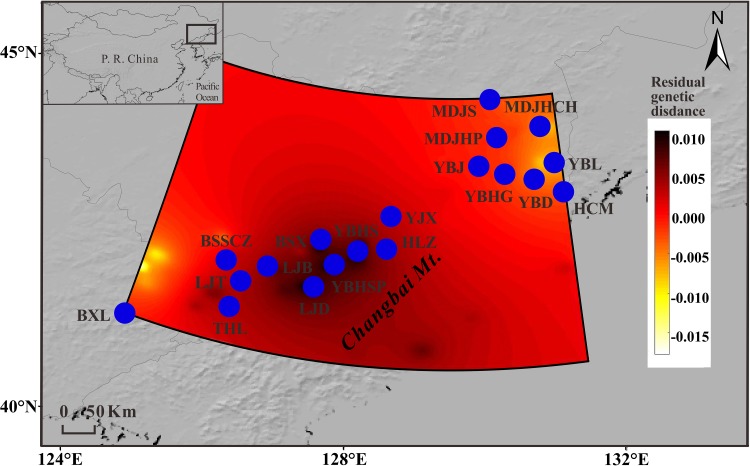
FIGURE 3.
Interpolated among-population residual genetic distances obtained using chloroplast DNA data across the range of T. cuspidata, conducted with a 50 × 50 grid specified. Higher (dark) and lower (white) residual genetic distance indicate higher and lower differentiation among natural populations, respectively.

