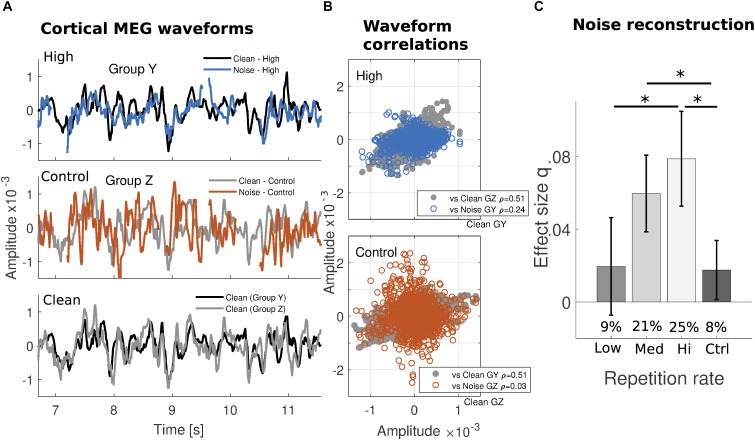
FIGURE 2.
Increased robustness of cortical reconstructability to missing speech under substantial prior exposure. (A) The median cortical MEG response waveforms from one cross-validation subject subgroup (group Y; NY = 5) exposed to a specific verse with High frequency, are contrasted with those from a different subgroup (group Z; NZ = 5) exposed to the same verse but infrequently (Control). Within the High repetition rate subgroup (top), signals generated by clean speech (black) and static noise replacing the missing speech (blue) appear to covary more than for the Control repetition rate subgroup (middle: gray and red, respectively). The waveforms in response to clean speech from both subgroups are replotted together for comparison (bottom). (Gaps in the responses to noise are due to intervals when the speech was never replaced by noise, or during noise onset or button presses.) (B) Correlation coefficients indicate that, while clean speech responses are similar to each other for both subgroups (gray, same data in both plots), for noise intervals, they are much more similar to the clean responses only when the verse is frequently repeated (blue, top), but not when infrequently repeated (red, bottom). For a comparison from other subgroups using High and Low repetition rate conditions, see Supplementary Figure S2. Median waveforms use the dominant auditory response component (see Supplementary Figure S1) and are determined for each time point over the subject group. (C) The missing dynamic speech envelope may be reconstructed from responses to noise, with performance of about 25% of that obtained under clean conditions (percentages inset for each bar). As indicated by the absolute q index dependence on presentation frequency using the noise-trained decoders, this result is not a consequence of any clean-trained decoders dependence on frequency. Error bars indicate confidence intervals for the means (Bonferroni-corrected α level).

