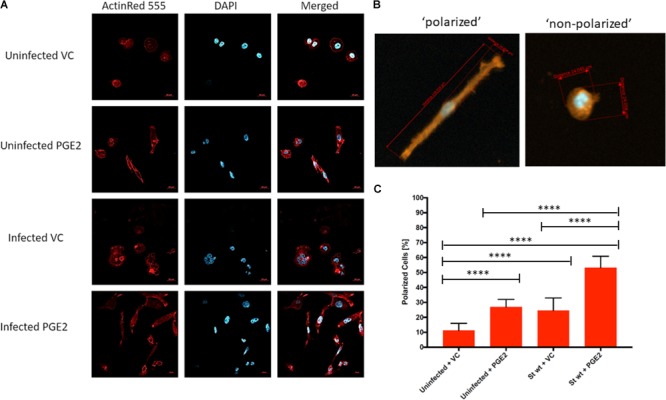
FIGURE 7.

Effect of PGE2 on macrophage morphology in S. Typhimurium-infected THP-1 macrophages. THP-1 macrophages (1.5 × 10⁶) were pre-treated with PGE2 (2 μM) or equal (v/v%) concentration of ethanol vehicle control for 2 h before infection with wild-type S. Typhimurium (MOI of 50:1, 48 hpi). Cells were then fixed, permeabilized, and stained for the actin cytoskeleton (ActinRed 555, red) and nucleus (DAPI, blue) (A). Polarized cells were determined by having a length to diameter ratio of at least 2:1. Approximately 30 cells were counted from five replicates for a total of 150 cells per treatment (Supplementary Table S1) (B). The number of polarized cells was counted and displayed as a percentage. Approximately 30 cells were counted from five replicates for a total of 150 cells per treatment. ANOVA test with Tukey’s multiple testing correction was used to establish statistical significance (C). p-values were indicated as follows: ∗p ≤ 0.05; ∗∗p ≤ 0.01; ∗∗∗p ≤ 0.001; ∗∗∗∗p ≤ 0.0001.
