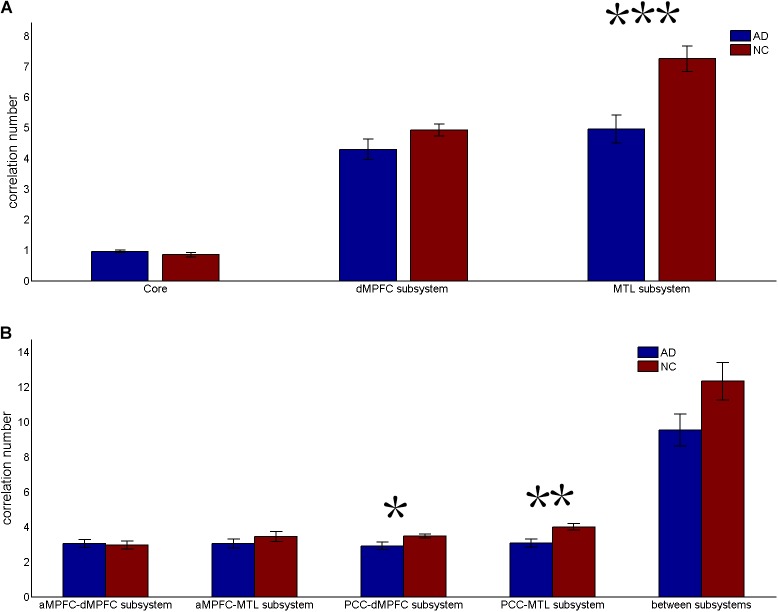
FIGURE 3.
Correlation number (positive-only) in the default network subsystems in the control and AD groups. (A) Correlation number within the core and subsystems in the two groups. (B) Correlation number between core regions (including the aMPFC and the PCC) and subsystems separately and between the two subsystems in the two groups (∗p < 0.05, ∗∗p < 0.01, and ∗∗∗p < 0.001). Error bars represent the standard error of the mean.

