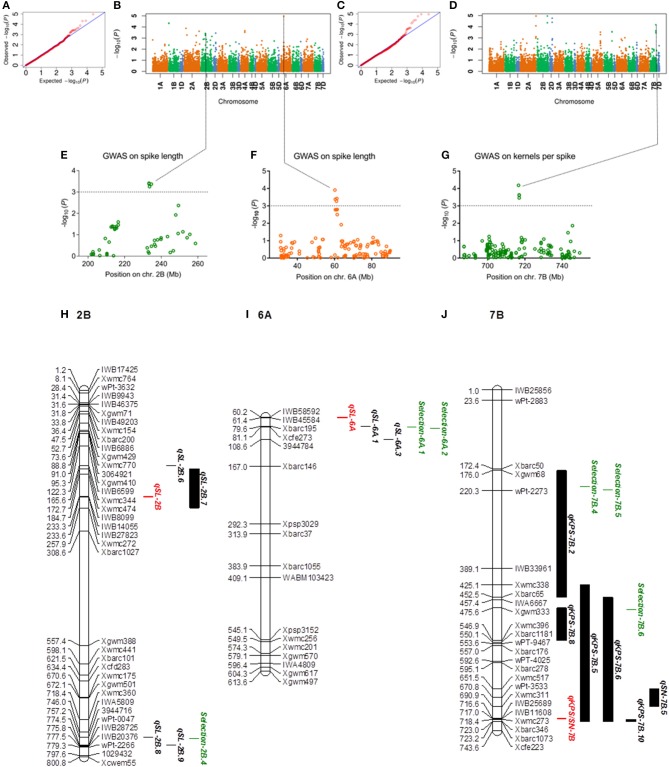
Figure 2.
GWAS results for spike length and kernels per spike. (A–D) Q-Q plot and Manhattan plot of SNPs associated with spike length and kernels per spike in two environments. (E–G) Manhattan plots of the SNP clusters on chromosomes 2B, 6A, and 7B. The SNP clusters on 7B represented cKPS/SN-7B. The dashed horizontal line depicted a significant threshold level. (H–J) The integrated physical map of SNP clusters and reported QTLs. The short arms of the chromosomes are located at the top. The physical positions of the marker loci are listed on the left side of the corresponding chromosomes. The names of the marker loci and QTLs are listed on the right side of the corresponding chromosomes. Red bar: SNP clusters; green bar: selection regions; black bar: reported QTLs.

