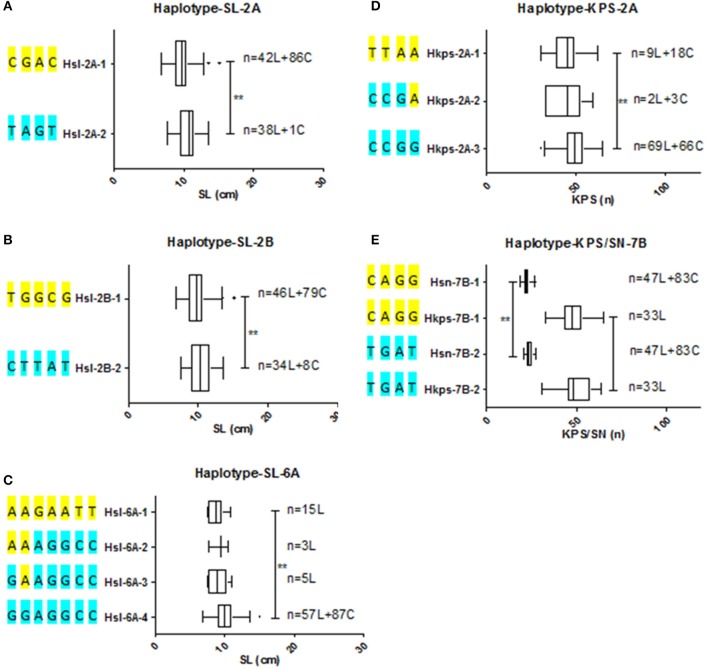
Figure 3.
Haplotypes and their distribute frequency of SNP clusters among wheat natural population (A–C) Haplotypes of SNP clusters for SL on chromosome 2A, 2B, and 6A, respectively. (D,E) Haplotypes of SNP clusters for KPS and KPS/SN on chromosome 2A and 7B, respectively. Extermun value and mean value of traits are displayed by the box plot. Statistical significance was determined by LSD test: **P < 0.01. n denoted the number of genotypes belonging to the haplotype. SL, spike length; SN, spikelet number; KPS, kernels per spike; L, landrace; C, cultivar.

