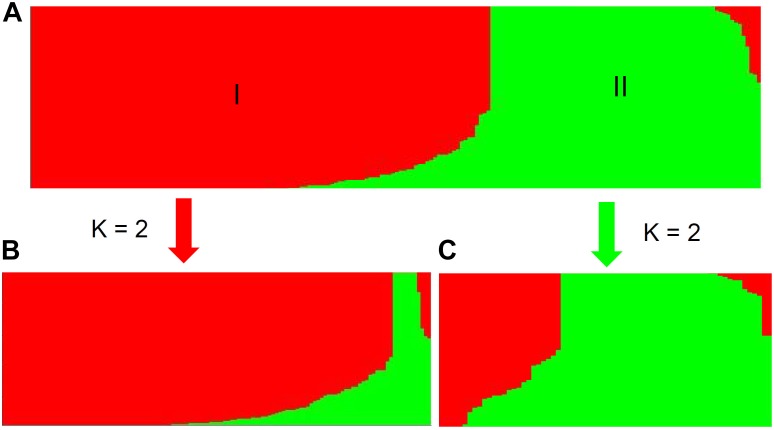
FIGURE 2.
Population structure of the whole accession panel and the two subspecies inferred from STRUCTURE analysis. The whole panel (A) was divided into two main groups (I and II). Each of the two subspecies, melo accessions (B) and agrestis accessions (C), was further subdivided into two subgroups, where K = 2.

