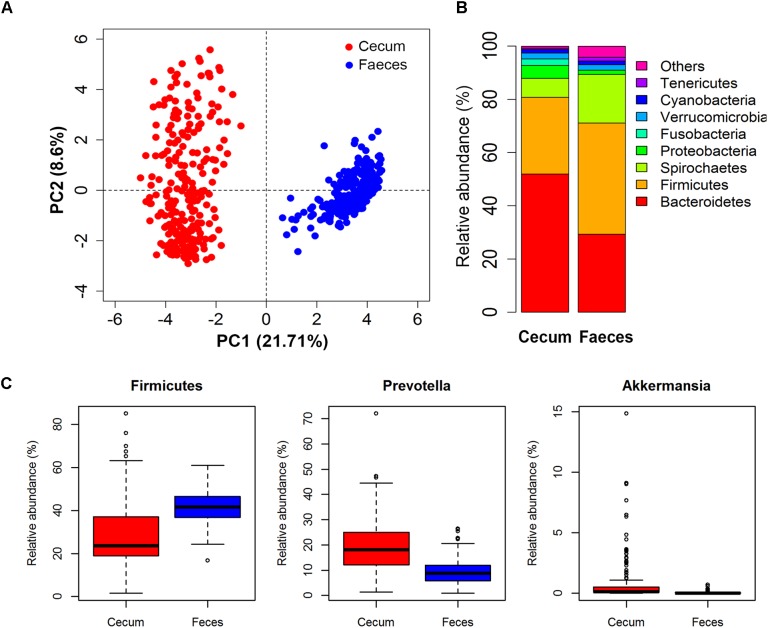
FIGURE 2.
Comparison of the microbial composition between two types of samples and among individuals within population with 16S rRNA gene sequencing data. (A) PCA analysis showed great difference of microbial composition between cecum lumen and feces; (B) Comparison of microbial composition at the phylum level; and (C) Distribution of relative abundances of bacterial genera among individuals. Samples/bacterial genera are represented along the horizontal axis, and relative abundance is denoted by the vertical axis.

