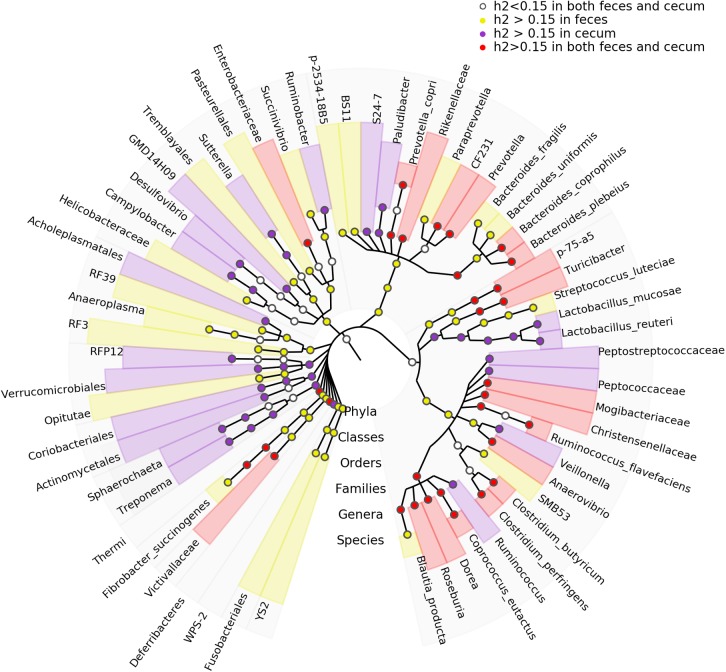
FIGURE 4.
Taxonomic representation of heritable bacteria taxa. The central dot in cladogram represents kingdom; each successive circle moving outward is one step lower phylogenetically. The phylogenic relationships of the taxa were obtained by the RDP database (Release 11.4). The circles showing different colors represent the taxa with different strength of heritability in cecum lumen and feces as measured by h2.

