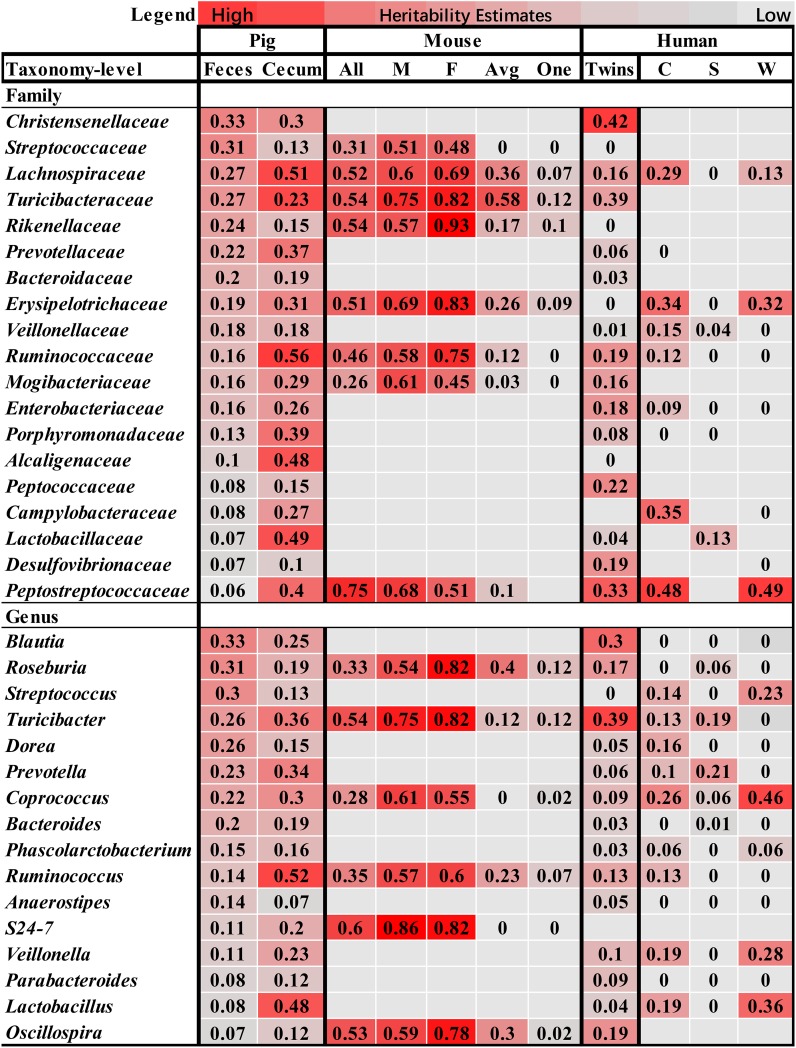
FIGURE 5.
Comparison of the heritability of microbial taxa among pig, human and mouse. The color gradient over the heritability estimates ranges from the lowest heritability estimate (white) to the highest heritability estimate (red) in the given study. The heritability estimates in mouse were obtained from the studies reported by Org et al. (2015b), in which heritability was estimated using all mice (All), male (M), female (F), an average per strain (Avg) and a single mouse per strain (One), and O’Connor et al. (2014). The estimates in human were referred to the studies by Goodrich et al. (2016a), and Davenport et al. (2015), in which the heritability was estimated in the Winter (W), Summer (S), and seasons combined dataset (C).

