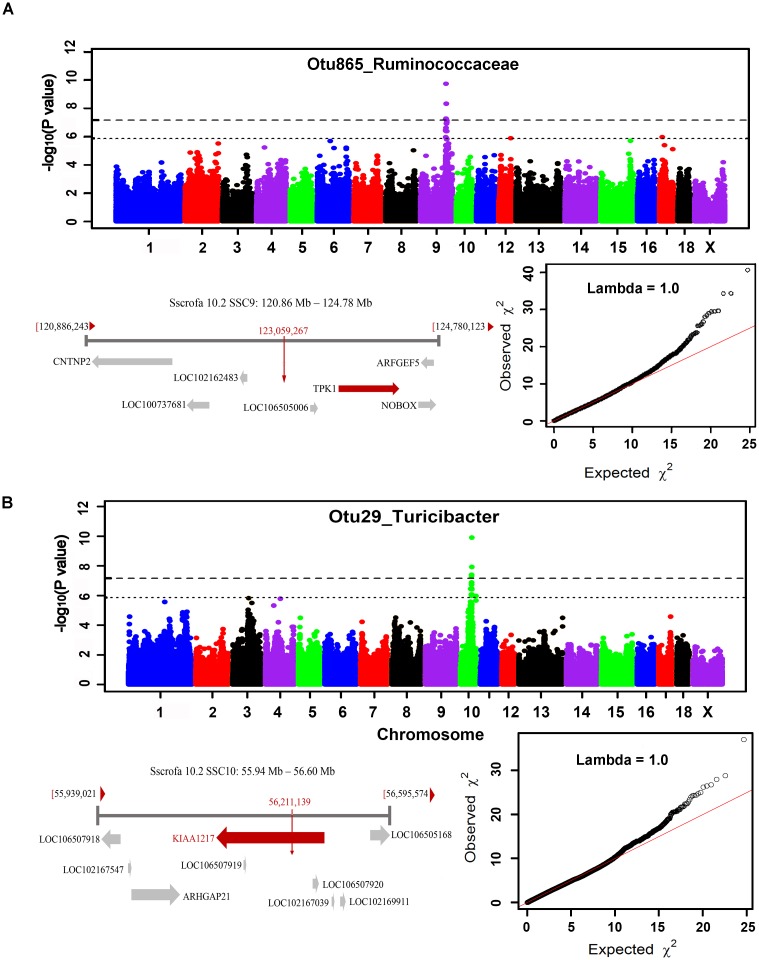
FIGURE 6.
GWAS results and candidate gene annotation for Ruminococcaceae (A) and Turicibacter (B). For Manhattan plots, X-axis shows chromosomal positions. Y-axis shows –log10 P-values from GWAS. The horizontal dotted lines indicate the thresholds of genome-wide and suggestive significance level. Candidate gene closest to the top SNP for each locus was identified based on Porcine reference genome assembly 10.2 in Ensemble. The red vertical lines indicate the positions of the top SNPs. The red horizontal arrow bar represents the closest gene.

