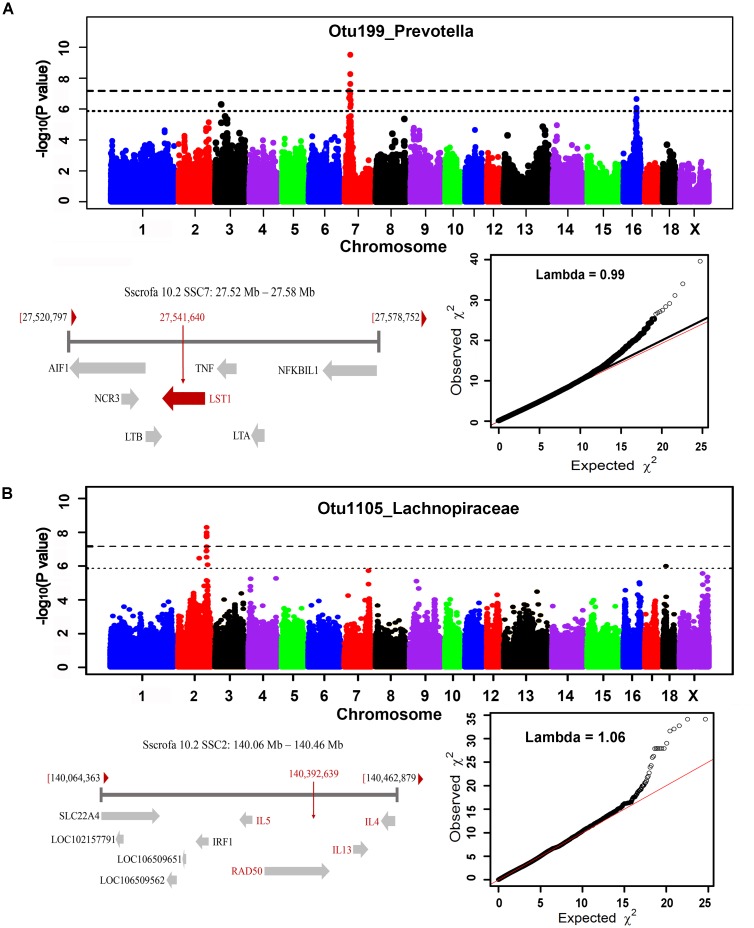
FIGURE 7.
MHC region on SSC7 (A) and interleukin gene family region on SSC2 (B) that were identified to associate Prevotella and Lachnospiraceae. For Manhattan plots, X-axis shows chromosomal positions. Y-axis shows –log10 P-values from GWAS. The horizontal dotted lines indicate the thresholds of genome-wide and suggestive significance level. The red horizontal arrow bar represents the closest gene.

