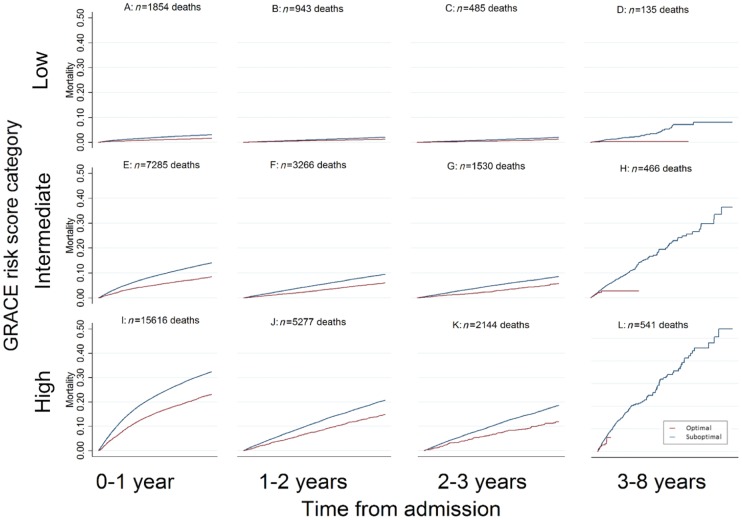
Figure 3.
Unadjusted landmark Kaplan–Meier survival curves and crude mortality rates by GRACE risk score category and receipt of optimal care vs. suboptimal care. This figure demonstrates the benchmarked crude mortality rates for the following time periods; 0–1 year, 1–2 years, 2–3 years, 3–8 years, across GRACE risk category by the receipt of optimal care. The percentages represent the crude mortality rates for each time period with the 95% confidence interval for each of the respective GRACE risk score categories. Population at risk at baseline; low GRACE risk category: 73 351, intermediate GRACE risk category: 59 201, high GRACE risk category: 52 005. Population at risk 3–8 years; low GRACE risk category: 70 069 intermediate GRACE risk category: 47 120, high GRACE risk category: 28 698.

