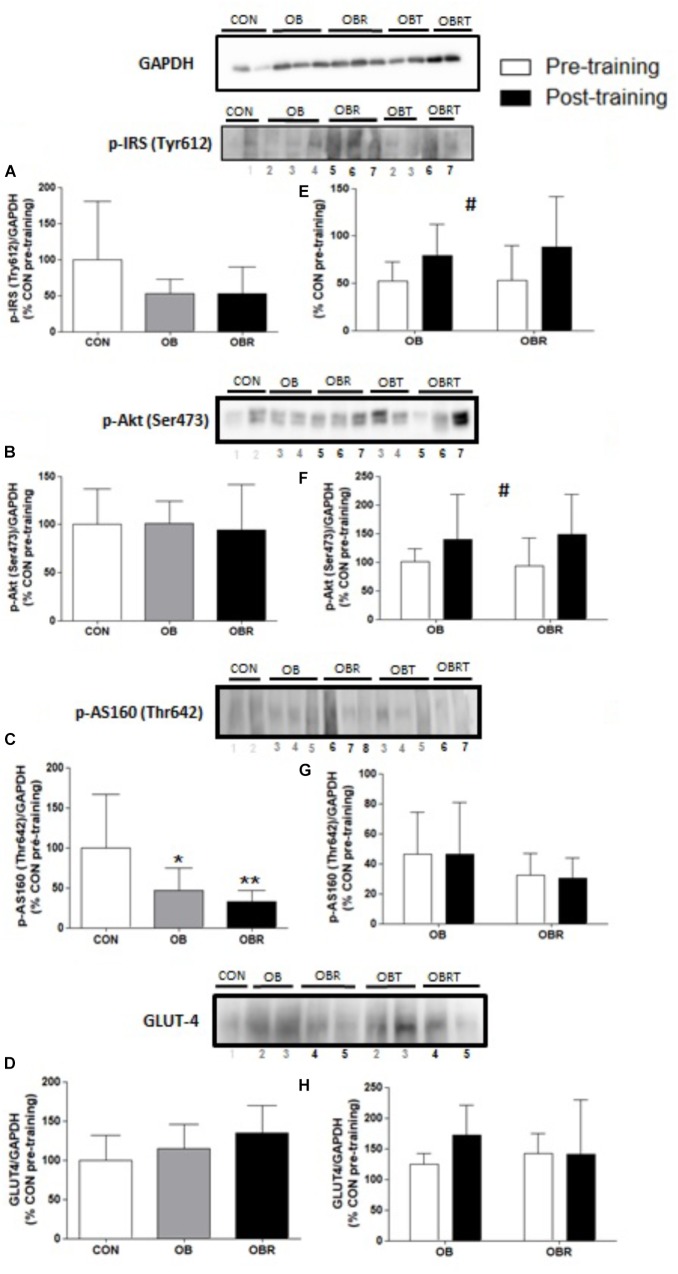
FIGURE 1.
Representative blot and data of the phosphorylation of IRS (Tyr 612), Akt (Ser 473), AS160 (Thr 642) and expression of GLUT4 in skeletal muscle of CON, OB, and OBR at baseline (A–D) and in OB and OBR groups before and after HIIT (OBT and OBRT) (E–H). Data are expressed as mean ± standard deviation, considering the control as 100%. CON: non-obese and non-insulin resistant; OB: obese non-insulin resistant pre-training; OBT: obese post-training non-insulin resistant; OBR: obese insulin resistant pre-training and OBRT: obese insulin resistant post-training. ∗Indicates difference between OB and CON at baseline (p < 0.05). ∗∗Indicates difference between OBR and CON at baseline (p < 0.05). #Indicates training effect (p < 0.05). CON (n = 3–5), OB (n = 7–8), and OBR (n = 6–7).

