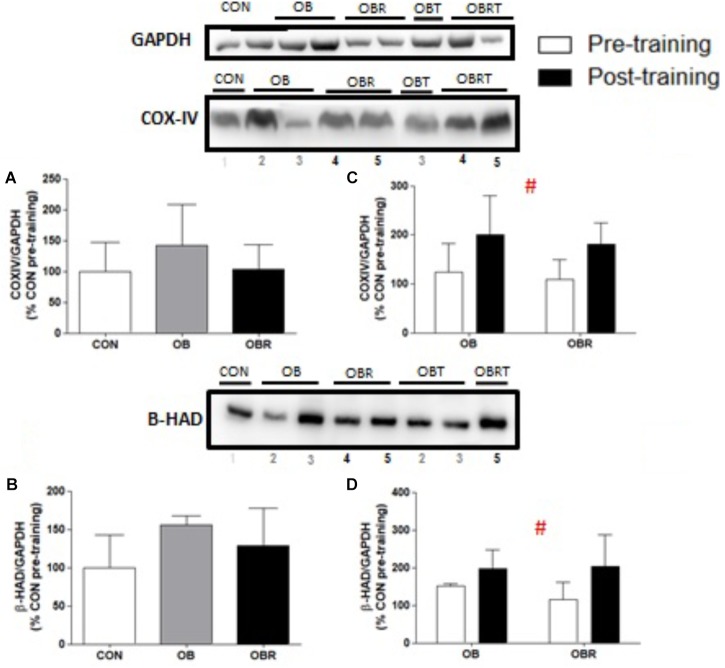
FIGURE 4.
Representative blot and data of COX-IV and β-HAD expression data in the skeletal muscle in the CON, OB, and OBR groups in pre-training (A,B) and in the OB and OBR groups before and after HIIT (C,D). Data are expressed as mean ± standard deviation, considering the control as 100%. CON: non-obese and non-insulin resistant; OB: obese non-insulin resistant pre-training; OBT: obese post-training non-insulin resistant; OBR: obese insulin resistant pre-training and OBRT: obese insulin resistant post-training. #Training effect. CON (n = 6–7), OB (n = 3–4), and OBR (n = 5–6).

