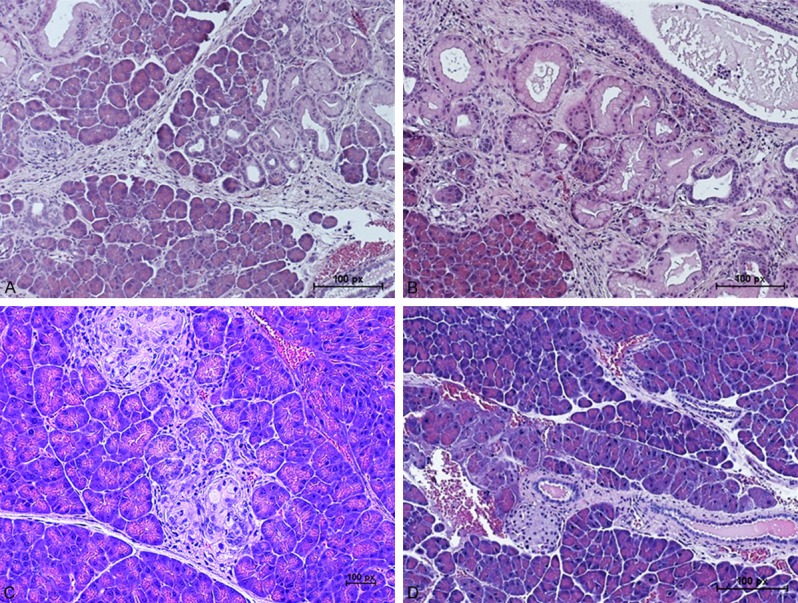
Figure 7.

Hematoxylin and eosin (H&E) staining of pancreatic tissues from ACS c-SLN treated LSL-Kras G12D/+; Pdx-1 Cre/+ transgenic mice (A) Blank c-SLN vehicle control group, (B) Low dose ACS c-SLN treated group, (C) Medium dose ACS c-SLN treated group, and (D) High dose ACS c-SLN treated group. (Scale bar - 100 px (1.17 µm/px)). [http://www.techinst.com/userfiles/files/How%20To%20Calibrate%200020.pdf].
