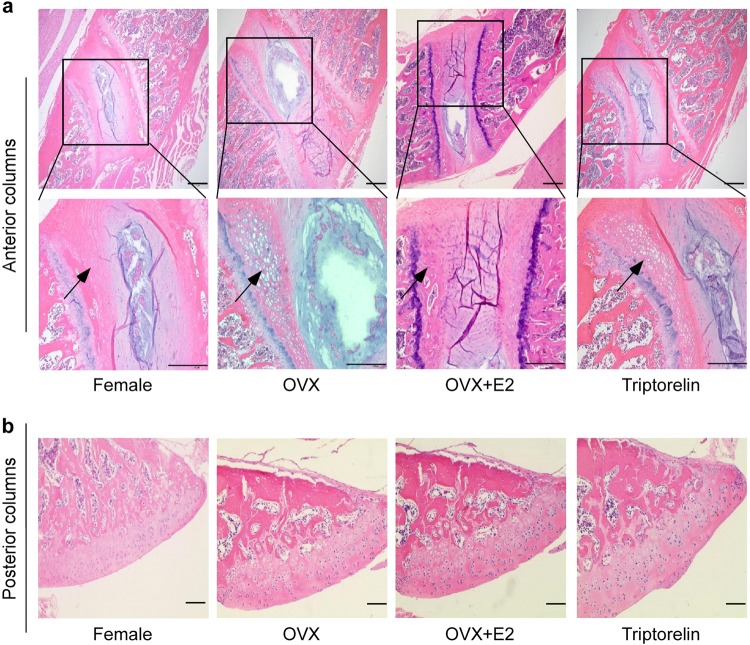
Fig. 3. Histomorphometric analysis of the vertebral growth plate cartilage in the four groups.
a H&E staining of anterior columns of the apical vertebra in the four groups of bipedal rats; the lower panel shows higher magnification images of the data shown in the upper panel (×100 and ×200). The cartilage hypertrophic zones (black arrow) were indicated. The height of the hypertrophic zone in the vertebral growth plate was significantly larger in the OVX and Triptorelin groups than in the female and OVX + E2 groups. The heights of the hypertrophic zone are presented below the images (Table 3). b H&E staining of posterior columns of the apical vertebra in the four groups of bipedal rats (×100). The height of the hypertrophic zone in the vertebral growth plate was significantly larger in the OVX and Triptorelin groups than in the female and OVX + E2 groups. No difference was observed in the articular cartilage of posterior columns among the four groups. Scale bar, 100 μm

