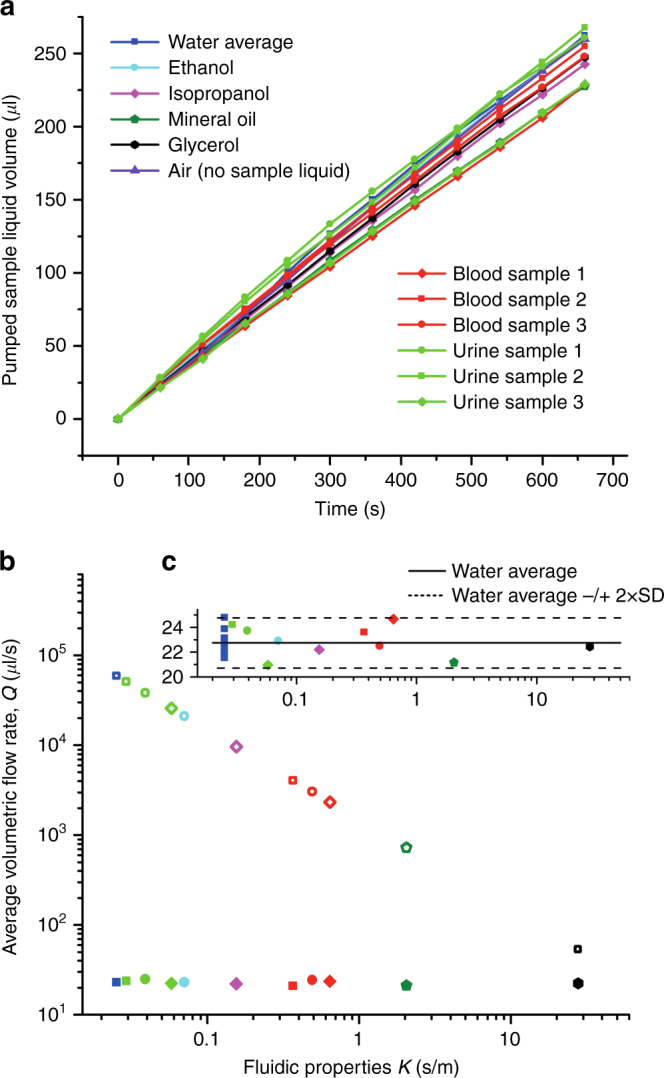
Fig. 2.

a Measurements of the pumped sample volume versus time for our novel capillary pump. Solid lines are for visualization purposes only. b Capillary volumetric flow rate, Q, versus κ for the sample liquids tested in our novel capillary pump (solid markers) and in standard capillaries (hollow markers). The volumetric flow rate was determined as the ratio of the measured total pumped sample volume over the measured total pumping time. The value depicted for water is the average over ten measurements. c Zoomed view of the novel capillary pump flow rate results with the ten flow rate values for water plotted separately. The solid and dashed lines indicate the average flow rate for water and two times the standard deviation of the flow rate for water, respectively.
