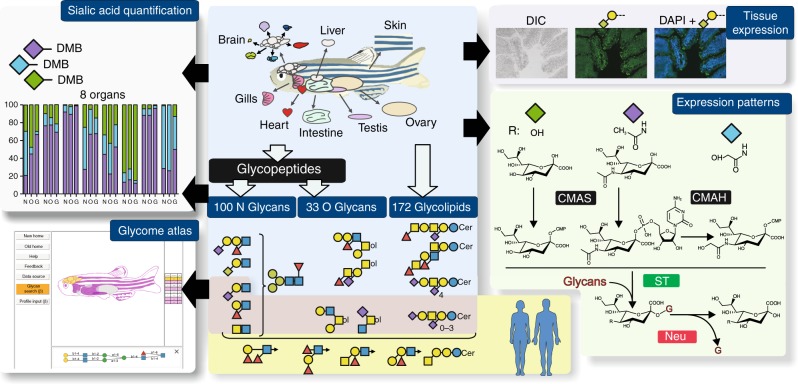
Fig. 1.
Analytical workflow. NGs, OGs, and GSLs were purified from single batches of freshly dissected tissues before analysis of sialic acids, monosaccharides, and oligosaccharide sequences. Unique glycan structures identified and their spatial distribution were posited in an interactive database, Glycome Atlas (http://rings.t.soka.ac.jp/GlycomeAtlasV5/index.html), to provide easy access to the zebrafish glycome. In parallel, the expression pattern of enzymes involved in sialic acid metabolism was established, along with the tissue expression of specific sialylated epitopes. Zebrafish glycome was shown to express many human-type glyco-epitopes, such as type-2 Galβ1-4GlcNAcβ1-based sialyl LacNAc and Lex, simple sialylated O-glycans and major gangliosides, but differed by carrying additional glycosyl extensions and the absence of some blood group antigens (A, B), type-1 Galβ1-3GlcNAcβ1-based epitopes, and globo-serie GSLs. CMAS CMP-Sia synthase, CMAH CMP-Sia hydroxylase, ST sialyltransferase, and Neu neuraminidase. Graphical representation is based on accepted conventions for glycans and monosaccharide nomenclature as follows: yellow circle, Gal; yellow square, GalNAc; blue circle, Glc; blue square, GlcNAc; green circle, Man; red triangle, Fuc; purple diamond, Neu5Ac; light blue diamond, Neu5Gc; green diamond, Kdn77,78. The interglycosidic bonds between monosaccharides of antennae are represented using the conventional positions as in |, C2 position; ∕, C3 position; −, C4 position; \, C6 position

