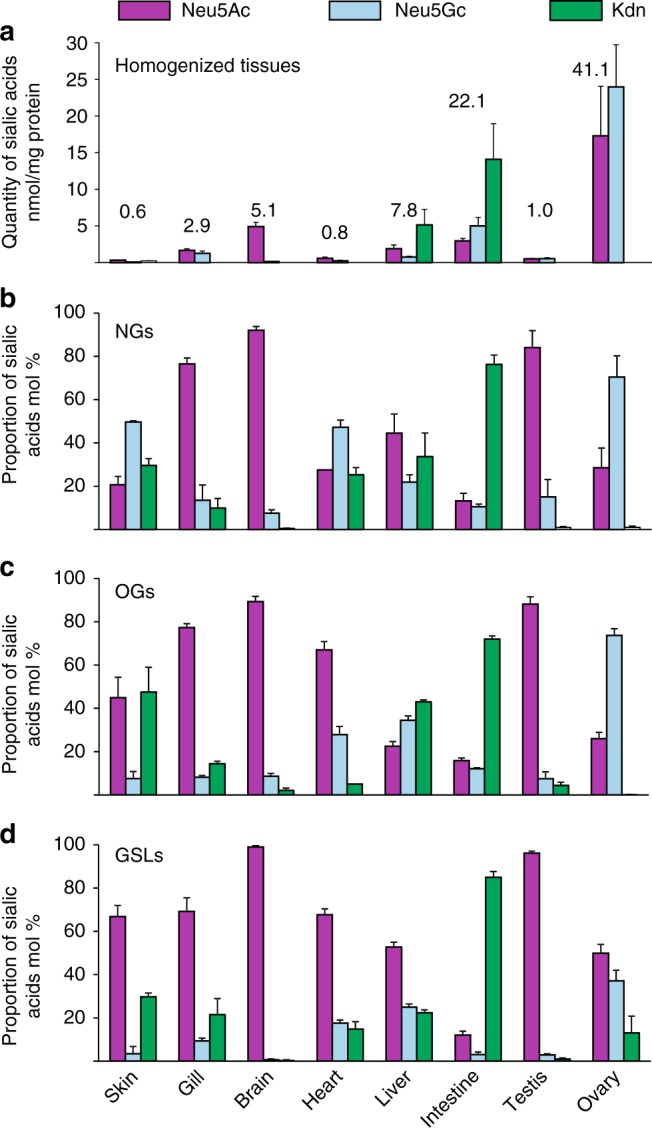
Fig. 2.

Sialic acids composition. Individual sialic acids were identified and quantified by NP-HPLC-FL and LC–MS analysis of (a) total tissues, as well as purified (b) NGs, (c) OGs, and (d) GSLs. In total tissues (a), quantities were expressed as nmol of sialic acids per mg of proteins. In purified glycans (b–d), proportions of individual sialic acids were expressed in mol% because the yield of glycan purification from total tissues cannot be precisely established. Purple bar, Neu5Ac; blue bars, Neu5Gc; green bars, Kdn. Data are shown as mean ± SE of at least three experiments
