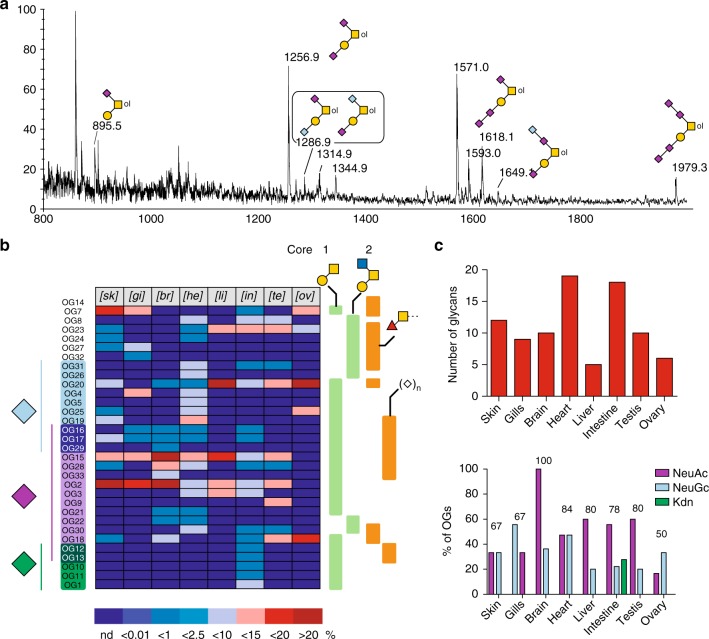
Fig. 5.
O-glycome profiles. a Representative MALDI-TOF MS spectra of permethylated OGs isolated from brain. All MS spectra are provided in Supplementary Figure 4. b Tissues-specific distribution and relative quantification of OGs according to following glycan epitopes: nature of substituting sialic acids (Neu5Ac, Neu5Gc, Kdn), core-1 Galβ1-3GalNAc, Core-2 Galβ1-3(GlcNAcβ1-6)GalNAc, Fucα1-3GalNAcβ, and oligosialylation. The nature of individual glycans was established by a combination of MS/MS, GC/MS, and NMR, in comparison with previous work28,29. Tissue-specific distribution of glycans is presented in Supplementary Data 2. Relative quantifications of individual compounds were extracted from dataset presented in Supplementary Figure 5. c Number of OGs identified in each organ (upper panel) and proportion of sialylated OGs in each organ expressed as the percentage of OGs substituted by any of the three sialic acids (purple bars, Neu5Ac; light blue bars, Neu5Gc; green bars, Kdn); numbers indicate the overall percentage of sialylated OGs relative to total OGs in the corresponding organs. It should be noted that a single OG may bear different types of sialic acids

