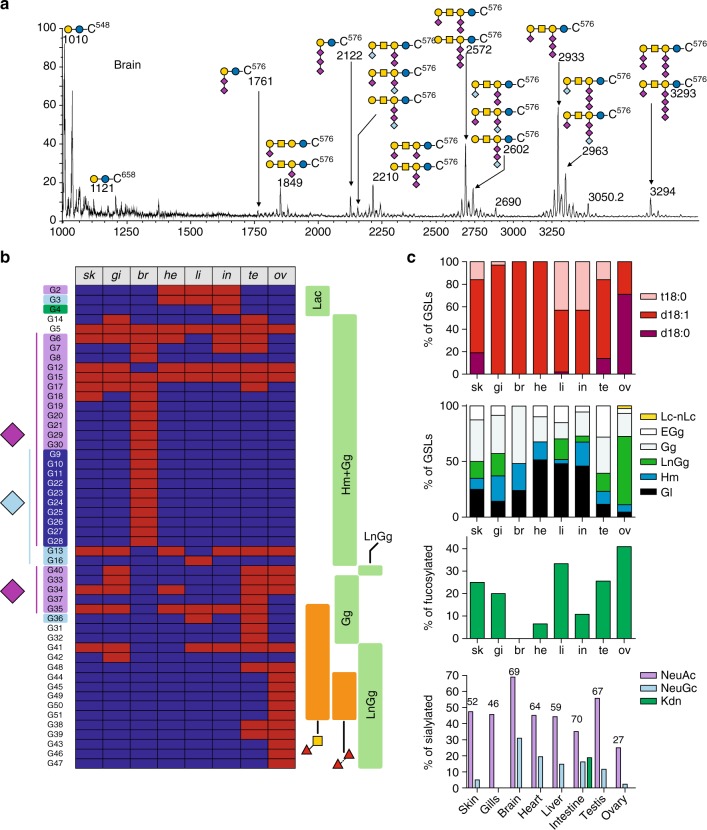
Fig. 6.
Glyco-lipidome profiles. a Representative MALDI-TOF MS spectra of permethylated GSLs isolated from brain. All MS spectra are provided in Supplementary Figure 6. b Tissue-specific distribution of the glycan moieties of GSLs according to following glycan epitopes: nature of substituting sialic acids (Neu5Ac, Neu5Gc, Kdn), the GSL families (Lacto; hemato and ganglio Hm + Gg; extended galglio ExGg; lacto-ganglio LnGg), Fucα1,3GalNAcβ, and oligo-fucosylation. The presence of multiple ceramides prevents reliable quantification. The identified species are depicted in red and the non-detected ones in dark-blue. c From top to bottom panels: distribution of ceramides expressed as the percentage of GSLs bearing one or the other sphingoïd base (dark red bars, d18:0; medium red bars, d18:1; light red bars, t18:0); distribution of families expressed as the percentage of GSLs from one or the other family; occurrence of fucosylation expressed as the proportion of GSLs substituted by at least one fucose residue; sialylation pattern expressed as the percentage of GSLs substituted by any of the three sialic acids (purple bar, Neu5Ac; light blue bars, Neu5Gc; green bars, Kdn); numbers indicate the overall percentage of sialylated GSLs relative to total GSLs in the corresponding organs. It should be noted that a single GSL may harbor different types of sialic acids

