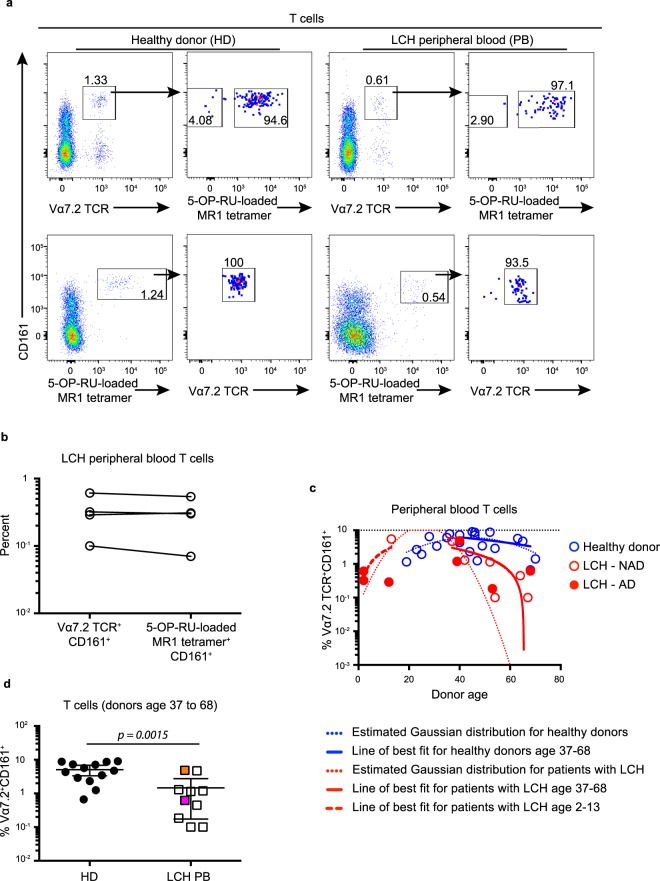
Figure 2.
Comparing MAIT cell proportions across different identification methods and age groups. (a) Gating strategy for identifying 5-OP-RU-loaded MR1 tetramer+ cells within the Vα7.2 TCR+CD161+ T cell population (top row) and Vα7.2 TCR+ cells within the 5-OP-RU-loaded MR1 tetramer+CD161+ T cell population (bottom row) in peripheral blood from healthy donors (left) and patients with LCH (right). Data are representative of at least 3 individual donors per group. (b) Matched proportions of Vα7.2 TCR+CD161+ T cells and 5-OP-RU-loaded MR1 tetramer+CD161+ T cells in total T cells from the peripheral blood of patients with LCH. (c) Proportions of MAIT cells in peripheral blood T cells from healthy donors (blue circles) and patients with active (AD) LCH (closed red circles) and non-active (NAD) LCH (open red circles) with imposed Gaussian distributions for each data set (dotted lines) and a line of best fit for healthy donors (solid blue line) and LCH patients (solid red line) aged 37–68, and for LCH patients aged 2–13 (red dashed line). (d) Proportions of MAIT cells in total T cells from the peripheral blood from healthy donors aged 37 to 68 and patients with LCH aged 37 to 68. An unpaired t Test with Welch’s correction was conducted for (d), error bars indicate mean + 95% confidence interval.

