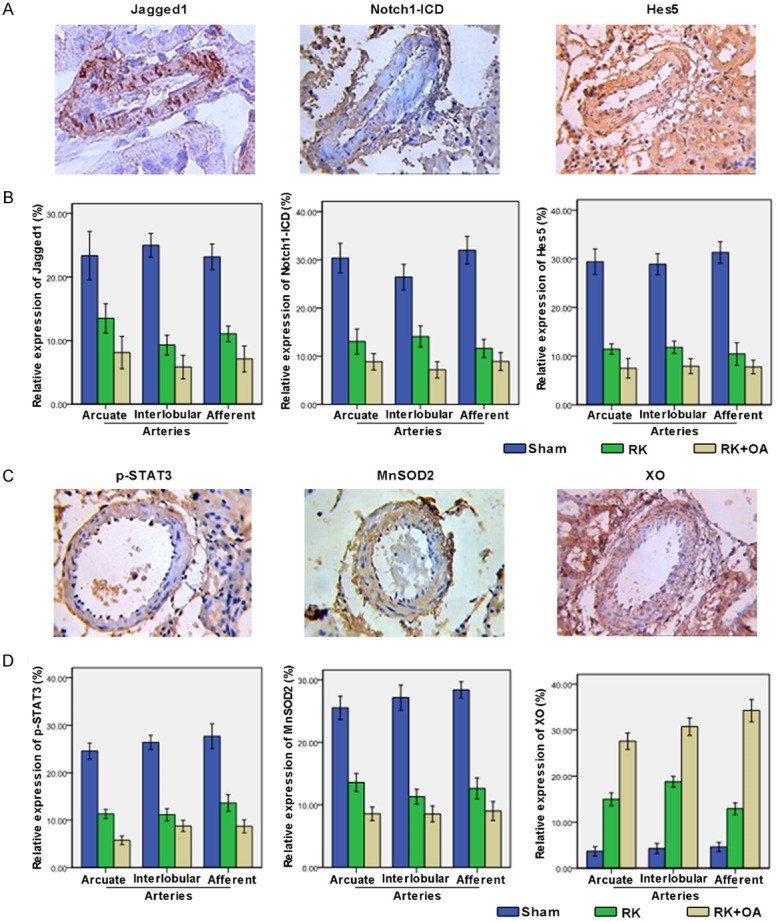
Figure 3.

Expression of Jagged1, Notch1-ICD, Hes5, p-STAT3, MnSOD2, and XO on the preglomerular arteries. A: Expression of Jagged1, Notch1-ICD, and Hes5 on the preglomerular arteries was analyzed by IHC, and representative images are shown. B: Quantitative analysis of the Jagged1, Notch1-ICD, and Hes5 levels. C: Representative images of p-STAT3, MnSOD2, and XO staining in the Sham group. D: The levels of p-STAT3, MnSOD2, and XO on the preglomerular arteries in each group were quantified.
