
Figure 10.
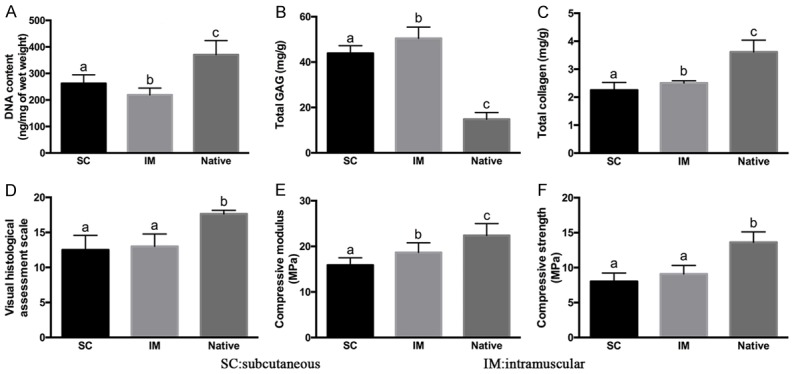
Biochemical and biomechanical evaluation of in-vivo regenerated tissue. Compared with group SC and group IM, the native group showed higher contents of DNA content (A), total collagen (C), as well as increased visual scale (D), compressive modulus (E) and compressive strength (F), but lower GAG content (B). Between the two regenerated groups, cell sheet intramuscular group displayed higher GAG, total collagen, compressive modulus and compressive strength, but lower DNA content than the SC group. Columns with different letters indicate statistical significance.