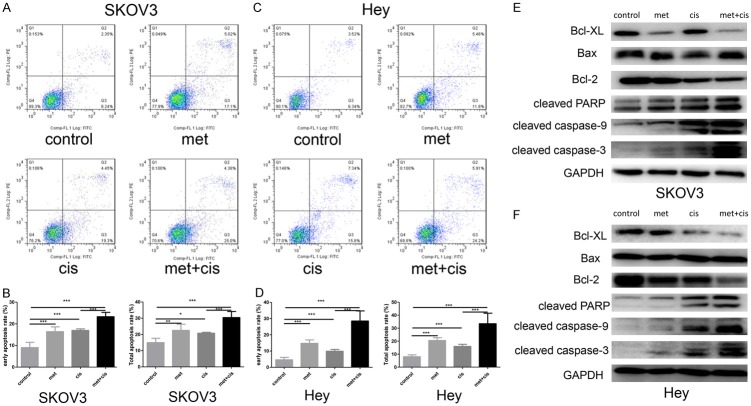
Figure 2.
Metformin promotes cisplatin-induced cell apoptosis in vitro. A-D. SKOV3 and Hey cells were divided into four groups: the control group, metformin group (20 mM), cisplatin group (1.6 µg/ml) and metformin + cisplatin group (20 mM metformin + 1.6 µg/ml cisplatin). Flow cytometric analysis was used to detect the apoptosis rate in different groups after 48 hours of treatment. E, F. Western blotting was performed to detect apoptosis-related protein expression in different groups after 48 hours of treatment. GAPDH was used as a loading control. *, P<0.05, **, P<0.01, and ***, P<0.001.

