
Figure 4.
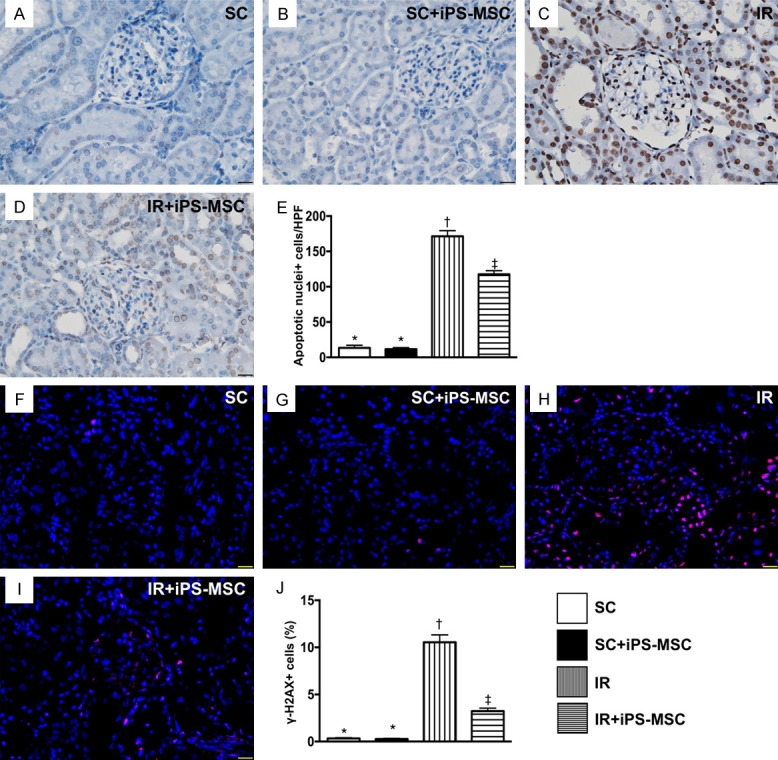
Cellular expressions of apoptotic and DNA-damaged markers in kidney parenchyma at day 5 after IR procedure. A-D. Illustrating the microscopic finding (400 ×) of TUNEL assay for identification of apoptotic nuclei (gray color). E. Analytical result of apoptotic nuclei, * vs. other groups with different symbols (†, ‡), P<0.0001. F-I. Showing the immunofluorescent microscopic finding (400 ×) for identification of γ-H2X+ cell (pink color). J. Analytical result of number of γ-H2X+ cells, * vs. other groups with different symbols (†, ‡), P<0.0001. Scale bars in right lower corner represent 20 µm. All statistical analyses were performed by one-way ANOVA, followed by Bonferroni multiple comparison post hoc test (n = 6 for each group). Symbols (*, †, ‡) indicate significance (at 0.05 level). HPFs = high-power field; SC = sham control; IR = ischemia reperfusion; iPS-MSC = human inducible pluripotent stem cell-derived mesenchymal stem cell.