
Figure 5.
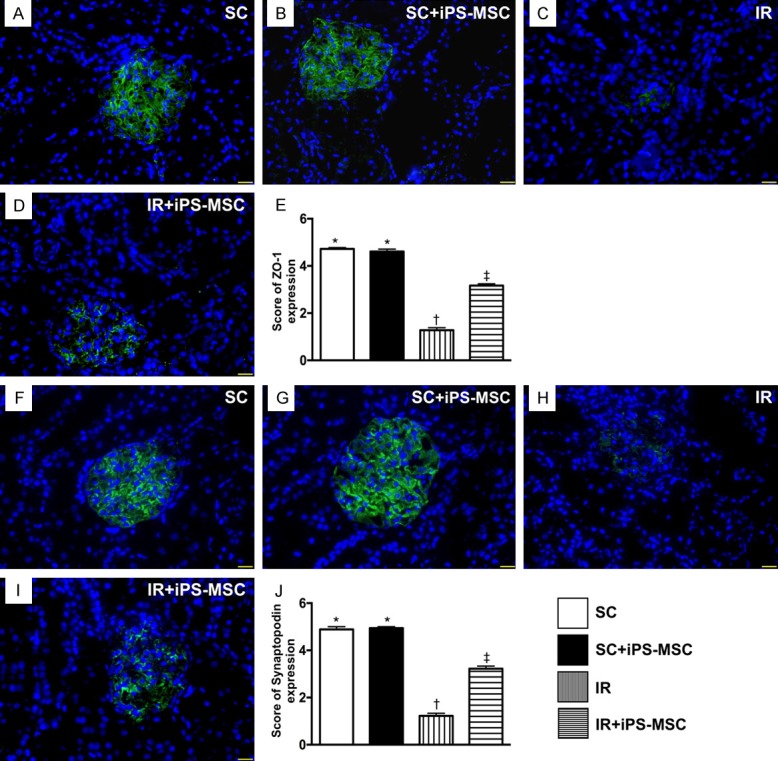
Identification of the expressions of ZO-1 and synaptopodin in glomeruli at day 5 after IR procedure. A-D. Immunofluorescent (IF) microscopic finding (400 ×) for identification of the expression of positively-stained ZO-1 in glomeruli (green color). E. Analytical results of ZO-1 expression, * vs. other groups with different symbols (*, †, ‡), P<0.0001. F-I. IF microscopic finding (400 ×) for identification of expression of positively-stained synaptopodin in glomeruli (green color). J. Analytical results of synaptopodin expression, * vs. other groups with different symbols (*, †, ‡), P<0.0001. Scale bars in right lower corner represent 20 µm. All statistical analyses were performed by one-way ANOVA, followed by Bonferroni multiple comparison post hoc test (n = 6 for each group). Symbols (*, †, ‡) indicate significance (at 0.05 level). SC = sham control; IR = ischemia reperfusion; iPS-MSC = human inducible pluripotent stem cell-derived mesenchymal stem cell.