
Figure 8.
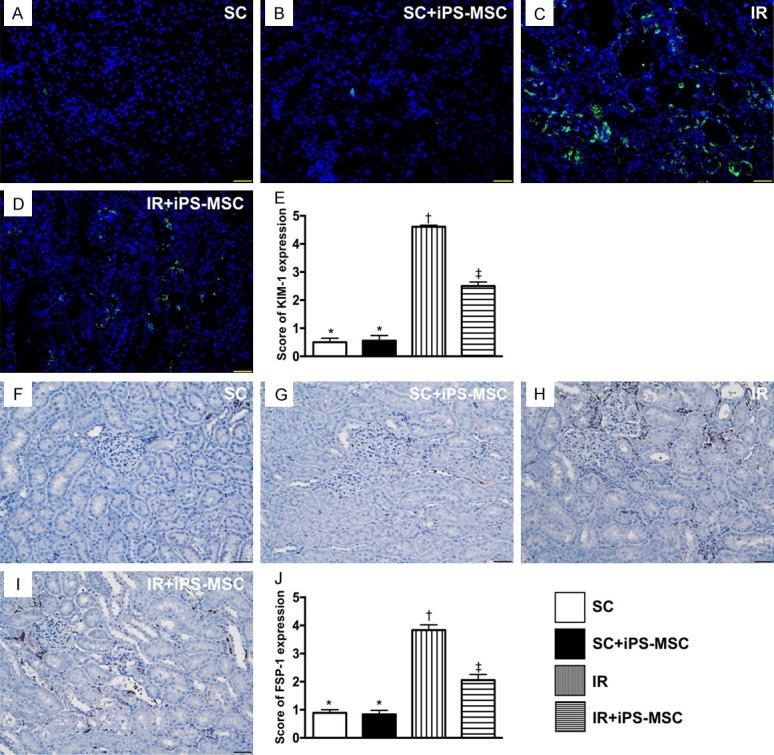
Identification of the expressions of KIM-1 predominantly in renal tubules and FSP-1 predominant in kidney interstitials at day 5 after IR procedure. A-D. Microscopic findings (200 ×) of immunofluorescent staining for identification of kidney injury molecule (KIM)-1 in renal tubules (green color). E. Analytical results of KIM-1 expression, * vs. other groups with different symbols (*, †, ‡), P<0.0001. F-I. Illustrating the microscopic finding (200 ×) of immunofluorescent staining for identification of fibroblast specific protein 1 (FSP-1) predominantly situated in kidney interstitials (gray color). J. Analytical results of FSP-1 expression, * vs. other groups with different symbols (*, †, ‡), P<0.0001. Scale bars in right lower corner represent 50 µm. All statistical analyses were performed by one-way ANOVA, followed by Bonferroni multiple comparison post hoc test (n = 6 for each group). Symbols (*, †, ‡) indicate significance (at 0.05 level). SC = sham control; IR = ischemia reperfusion; iPS-MSC = human inducible pluripotent stem cell-derived mesenchymal stem cell.