
Figure 1.
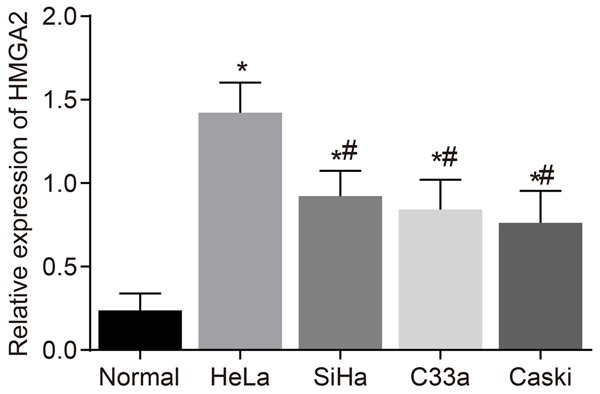
HeLa cell line was identified with the highest HMGA2 expression after RT-qPCR detection. Notes: *, P<0.05 vs. the control group; #, P<0.05 vs. the HeLa cell line; the data of RT-qPCR were measurement data, expressed by mean ± standard deviation. The comparison of data among multiple groups were analyzed by one-way ANOVA; the experiment was repeated 3 times; RT-qPCR, reverse transcription quantitative polymerase chain reaction.