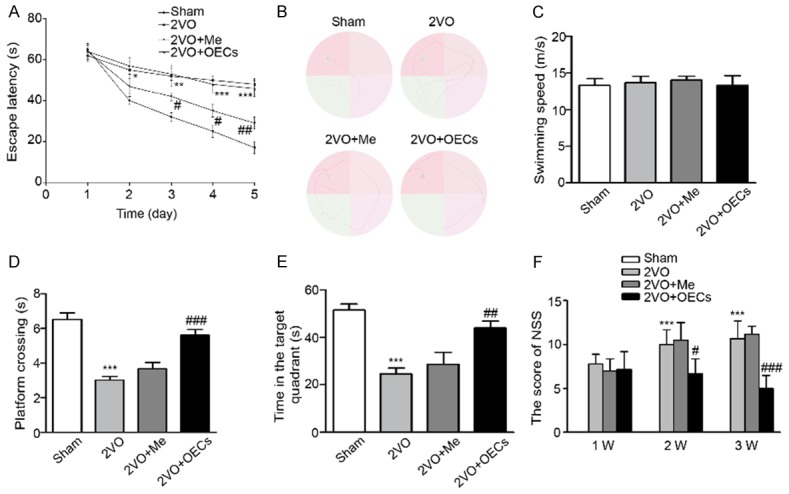
Figure 2.

Effects of OECs transplantation on the performance of rats in morris water maze after OECs treatment. A. Latency to reach platform of four groups on the first 5 training days. B. Representative swim traces of the rats in morris water maze test on the fifth day. C. Swimming speeds were measured in the four groups. D. The number of crossing the platform of four groups. E. Time spent in the target quadrant of four groups. F. The neurological severity score of the rats after transplantation with or without OECs in four groups. Data were expressed as mean ± SEM (n = 5 per group). **P<0.01 vs. the Sham group, ***P<0.001 vs. the Sham group, ##P<0.01 vs. the 2VO group, ###P<0.001 vs. the 2VO group.
