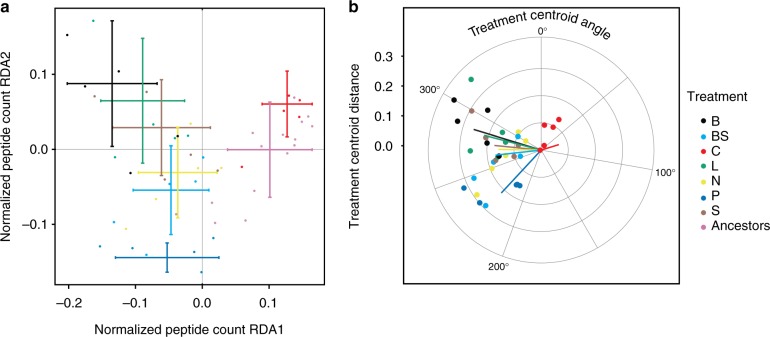
Fig. 1.
RDA analysis of protein expression levels explained by treatments and conditioned by population. Protein expression levels include 3347 response variables and consist of 51 independent observations. a The selection treatments cause significant differences in the protein expression levels (redundancy analysis, RDA; permutational ANOVA; p < 0.001; error bars represent standard errors). The first two RDA axes explain 74% of the total variation (which totals at 0.00586 units). Ancestral and control treatments are separated from the other treatments by Axis 1 (ANOVA; TukeyHSD post hoc test p < 0.01) and the low-phosphate treatment is separated from ancestors, controls, biotic, low-light, and high-salt treatments by Axis 2 (ANOVA; TukeyHSD post hoc test p < 0.01). b The angles and distances of each treatment from the ancestral mean on the RDA plane. All treatments exhibit convergent trajectories with the significant exception of the control (p < 0.01; TukeyHSD post hoc test)

