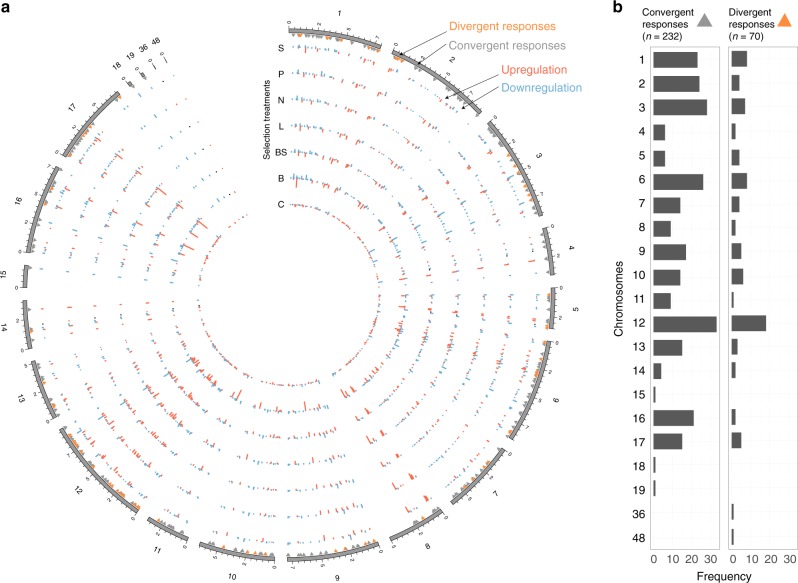
Fig. 2.
Chromosomal loci of the differentially expressed proteins. a Proteins where the expression of at least one treatment is significantly different from the ancestors (t test p < 0.01; n = 1304; 39% of the total detected proteins). b Among these, 351 proteins exhibit a differential response from the control (Dunnett test p < 0.05). These differentially expressed proteins classify into divergent (Friedman test p < 0.1; n = 70) and convergent responses (Friedman test p > = 0.1; n = 232). Both convergent and divergent responses are non-randomly distributed across the chromosomes (chi-square test; p < 0.0001)

