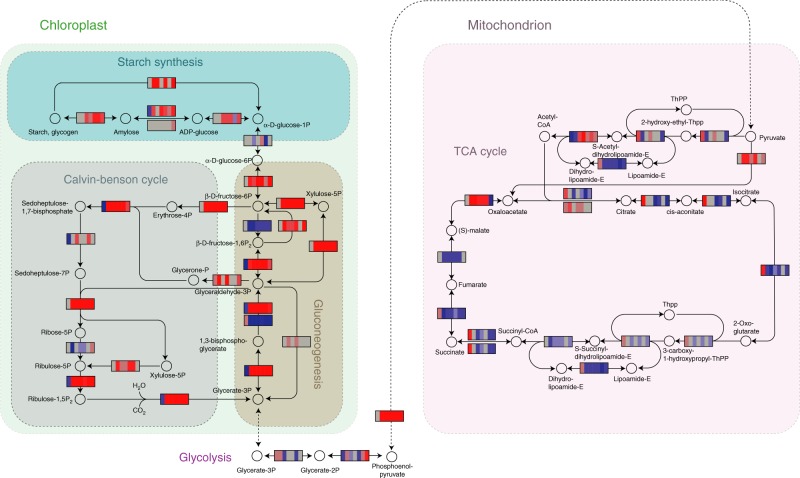
Fig. 4.
Core metabolic pathways of C. reinhardtii. The circles represent metabolites, and the rectangular heat maps the enzymes, with blue indicating downregulation, red upregulation, and gray no significant change. The order of the colored boxes within the heat maps correspond to the selection treatments (as in Fig. 3), and the protein expression scale corresponds to the normalized peptide intensities. Metabolic functions are indicated by shading in the following colors: Calvin–Benson cycle (gray); Starch synthesis (cyan); Gluconeogenesis (brown); TCA cycle (pink). The most consistent response among the different selection treatments is the upregulation of anabolic functions including of the photosynthetic machinery, Calvin–Benson cycle and gluconeogenetic pathways. The Calvin–Benson cycle produces glycerate-3-phosphate (G3P), which is likely channeled up the gluconeogenetic pathway into α-D-glucose-6-phosphate. By contrast, catabolic functions of the TCA cycle (for respiration) and the conversion of G3P into glycerate-2-phosphate are being mostly downregulated

