
Figure 2.
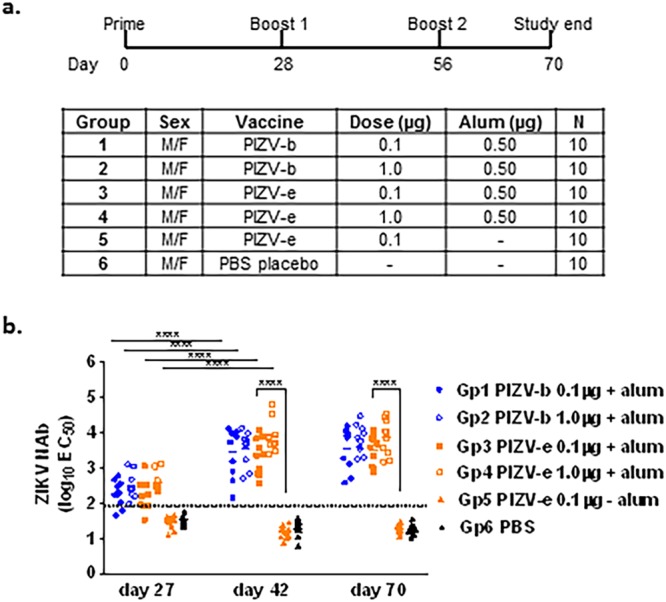
PIZV immunogenicity in CD1 mice. (a) Test groups and schedule of dosing. (b) Serum NAb titers of immunized CD-1 mice as determined by RVP neutralization assay. Solid lines represent the geometric mean titer (GMT) of EC50 for each group. The limit of detection (1.9 log10) is represented by a dashed line. Samples with a titer below the detection limit were included in the GMT calculation. Data were analyzed by one-way ANOVA with Tukey’s multiple comparisons test: **** indicates p < 0.0001.