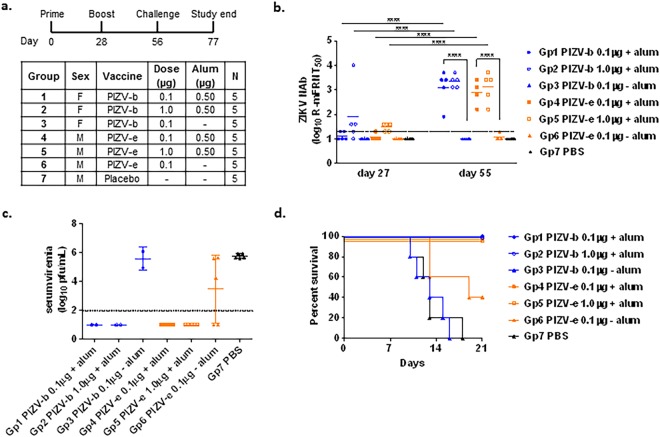
Figure 3.
PIZV immunogenicity and efficacy in AG129 mice. (a) Test groups and schedule of dosing. (b) Serum NAb titers as determined by R-mFRNT of immunized AG129 mice. Solid lines represent the group GMT of the reciprocal serum dilution required for at least 50% reduction of viral foci. The limit of detection (1.3 log10) is represented by a dashed line. Animals with no detectable titer (<1.3) were assigned a titer of 1.0 for visualization and GMT calculation. Data were analyzed by one-way ANOVA with Tukey’s multiple comparisons test: ****indicates p < 0.0001. (c) Infectious virus titers of individual mouse serum samples two days post-challenge, shown as pfu/mL. Solid lines represent the GMT of a group. Error bars represent standard deviation. The limit of detection (2.0 log10) is represented by a dashed line. Animals with no detectable titer (<2.0) were assigned a titer of 1.0 for visualization and GMT calculation. (d) Kaplan-Meier survival curve of test groups post-challenge.

