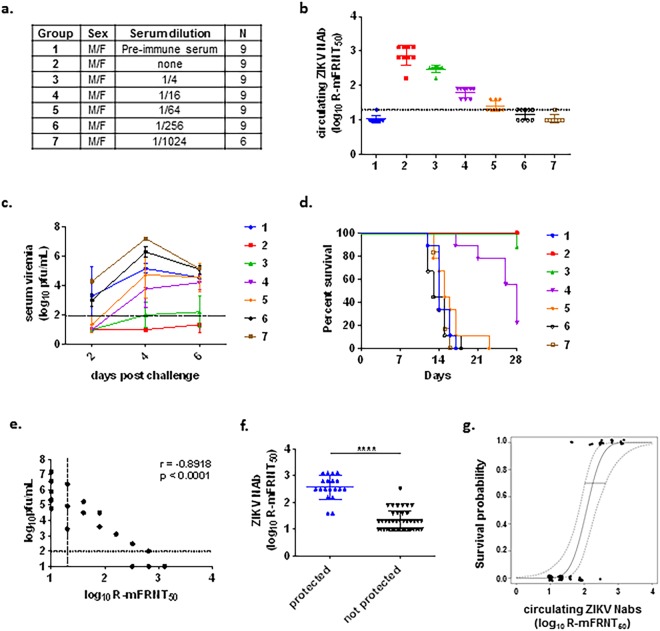
Figure 4.
Passive immunization of ZIKV immune sera in AG129 mice. (a) Test groups. (b) Circulating serum NAb levels measured by R-mFRNT, prior to challenge. Solid lines with error bars represent the GMT with standard deviation. The limit of detection (1.3 log10) is represented by a dashed line. Animals with no detectable titer (<1.3) were assigned a titer of 1.0 for visualization and GMT calculation. (c) Infectious viremia titers of individual mice post-challenge. Solid lines with error bars represent the GMT with standard deviation. The limit of detection (2.0 log10) is represented by a dashed line. Animals with no detectable titer (<2.0) were assigned a titer of 1.0 for visualization and GMT calculation. (d) Kaplan-Meier survival curve of test groups post-challenge. (e) Correlation analysis of circulating serum NAb titers at the time of challenge and viremia after challenge. Data used for this analysis were from 3 mice/group based on the group peak viremia day. Horizontal dashed line represents the limit of detection of the plaque assay, and vertical dashed line represents the limit of detection of the R-mFRNT assay. A Spearman rank correlation test was used to determine a rho and p value. (f) Comparison of circulating serum NAb titers following passive transfer in protected and unprotected test groups at 28 days post challenge. Geometric mean is indicated by a solid bar. The **** symbol indicates a p value < 0.0001 using a Wilcoxon rank test. (g) Fitted logistic regression model for survival as a function of circulating NAb titers following passive transfer. An inverse prediction of 70% is indicated by a horizontal line. Dashed lines indicate a 95% confidence interval.

