An official website of the United States government
Here's how you know
Official websites use .gov
A
.gov website belongs to an official
government organization in the United States.
Secure .gov websites use HTTPS
A lock (
) or https:// means you've safely
connected to the .gov website. Share sensitive
information only on official, secure websites.

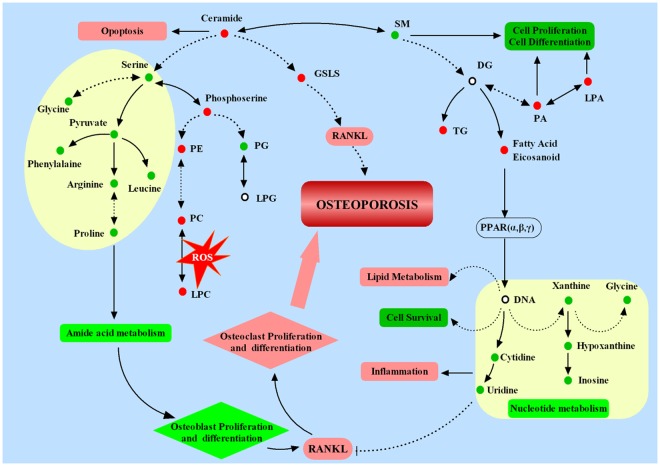
 : Increased in OVX group compared with shame group;
  : Decreased in OVX group compared with shame group. Solid line: direct connection, Dotted line: indirect connection. →: transform or promote, ⊥: Inhibit.