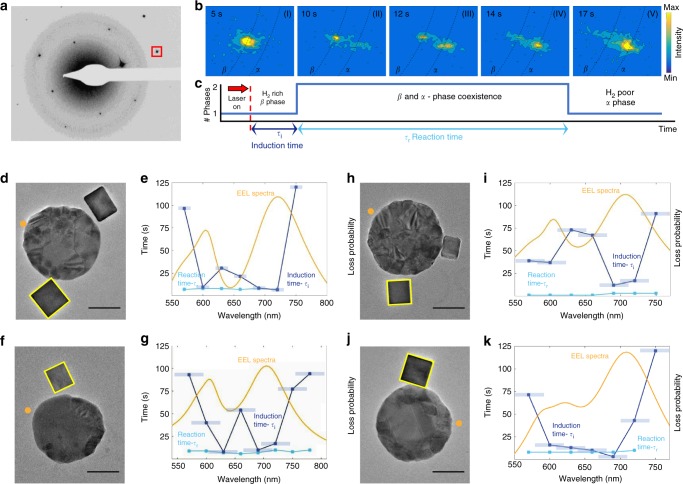
Fig. 2.
Wavelength dependence of the two reaction steps. a An electron diffraction micrograph of a single Pd nanocube shown in f. The highlighted 400 diffraction spot is monitored for the analysis of the evolution of the phase transformation reaction shown in b. b Time snapshots of a zoomed-in diffraction spot showing the emerging α phase and the vanishing β phase upon illumination. The black dotted lines correspond to the arc delineating constant lattice parameter (see Supplementary Fig. 1 as well). c A timeline describing the evolution of the phase transformation reaction with the two characteristic time constants, the induction time and the reaction time. d, f, h, j Transmission electron microscope images of four antenna-reactor pairs with highlighted Pd cubes for which the wavelength dependence analyses appear in e, g, i and k. Scale bars are 50 nm. e, g, i, k Wavelength dependence of the induction time constant (dark blue) and the reaction time constant (light blue). The error bars correspond the bandwidth of the laser. Simulated EEL spectra are shown in orange with an electron beam impact position marked with a dot in the corresponding TEM images

