Fig. 3.
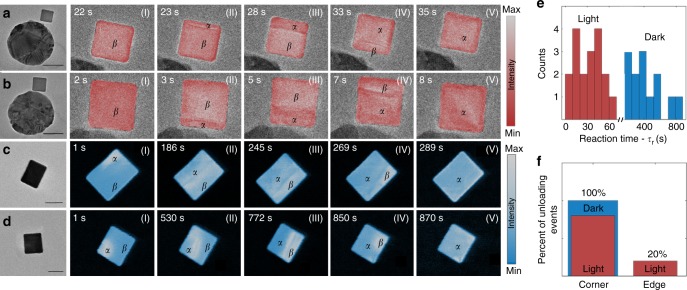
Comparison between dark and light-induced phase transformation reaction. a–d Snapshots of (scanning) transmission electron microscope movies of the phase transformation reaction in the antenna-reactor (isolated) configuration with(out) illumination at 690 nm. Scale bars are 50 nm. e Histograms showing the distribution of reaction times for the plasmon-induced phase transformation (red) and the spontaneous phase transformation (blue) as measured in STEM mode. f Corner vs. edge unloading mechanism with and without illumination, also measured in STEM mode

