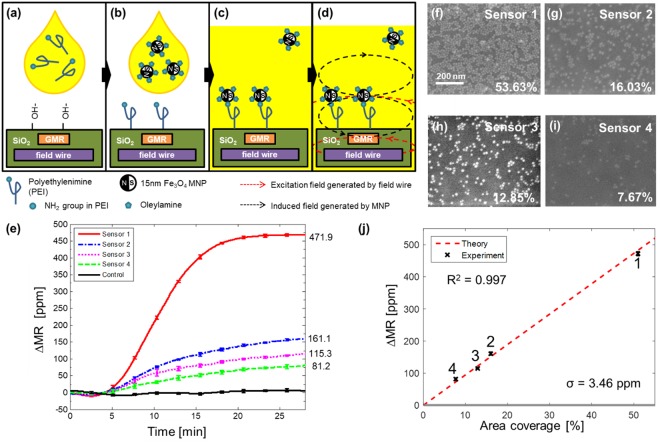
Figure 6.
Quantitative detection of superparamagnetic nanoparticles in a proof-of-concept experiment. (a) The surface is functionalized using ozone plasma then PEI in chloroform solution is applied. (b) The residue is cleaned then MNPs in hexane solution are introduced. (c) MNPs are tightly bound to PEI through ligand exchange. (d) When integrated field wires generate magnetic excitation field around GMR sensors, MNPs in close proximity produce induced field that is sensed by the GMR sensors. (e) Measured binding curves of different PEI coverages. (f–i) Scanning electron microscopic images showing MNPs bound to sensor surface. Coverage area is measured using image processing software. (j) ∆MR versus area coverage by MNPs curve. ∆MR is proportional to area coverage, which corresponds to the number of MNPs. Error bars represent one standard deviation. Dashed line represents a theoretical calculation of ∆MR from 0 to 100% coverage.

