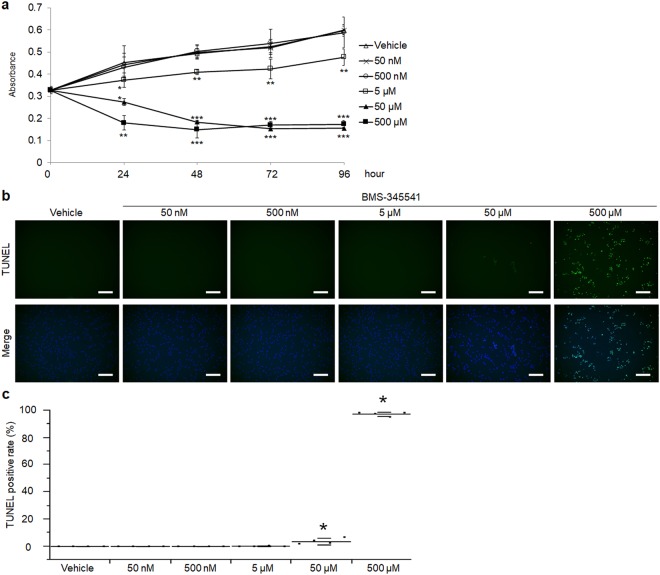
Figure 4.
Proliferation and apoptosis of human articular chondrocytes treated with BMS-345541. (a) CCK-8 assay of human primary articular chondrocytes treated with different concentrations of BMS-345541 with or without 10 ng/ml IL-1β. Data are expressed as the mean of three wells per group. Error bars indicate 95% confidence interval. *P < 0.01, **P < 0.001, ***P < 0.0001 vs vehicle at each time point by the Kruskal–Wallis test and Dunn’s post hoc test for unequal variance. TUNEL stainings (b) and the rates of TUNEL positive cells (c) of human articular chondrocytes treated with vehicle or 50 nM, 500 nM, 5 µM, 50 µM, 500 µM BMS-345541 for 12 hours. Scale bars, 200 µm. Symbols represent individual points; long and short bars show the mean and SD of four slides per group, respectively. *P < 0.05 vs vehicle by Kruskal-Wallis test & Dunn’s post hoc test for unequal variance.

