
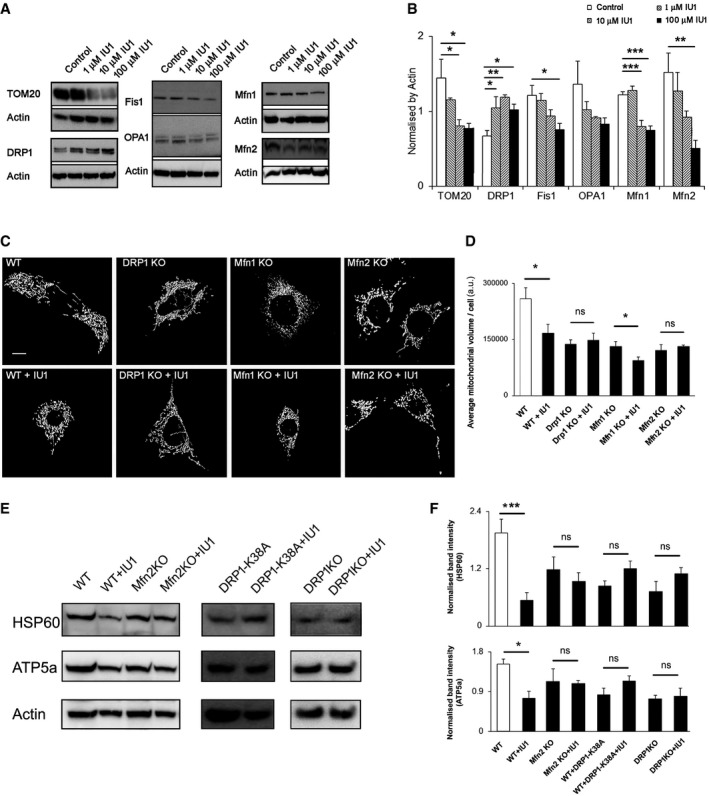
Figure 2. IU1‐facilitated mitochondrial clearance is DRP1 and Mfn2 dependent.
-
A, BWestern blot analysis of the indicated proteins in cell lysates from SH‐SY5Y cells, treated with different concentrations of IU1 (1–100 μM) for 24 h. Bar graphs represent the mean ± SEM. Blots are representative of three independent experiments. ANOVA followed by Dunnett's test.
-
C, DRepresentative images of MEF cells knocked out for the indicated mitochondrial dynamics proteins and transfected with mito‐YFP (C) with/without IU1 treatment (100 μM, 48 h). Scale bar: 10 μm. (D) Mitochondrial volume/cell was measured as described and is represented as mean ± SEM. At least 35 cells were evaluated. Student's t‐test.
-
E, FWestern blot analysis of HSP60 and ATP5a as mitochondrial markers in the indicated knockout MEF cells (with/without the indicated DRP1 variant) after 48 h of IU1 treatment. Bar graphs represent the mean ± SEM; n = at least 3. Student's t‐test.